

Important: There is no guarantee that ATS strategies will have the same performance in the future. I use backtests and forward tests to compare historical strategy performance. Backtests are based on historical data, not real-time data so the results shared are hypothetical, not real. Forward tests are based on live data, however, they use a simulated account. Any success I have with live trading is untypical. Trading futures is extremely risky. You should only use risk capital to fund live futures accounts and if you do trade live, be prepared to lose your entire account. There are no guarantees that any performance you see here will continue in the future. I recommend using ATS strategies in simulated trading until you/we find the holy grail of trade strategy. This is strictly for learning purposes.
As a quick reminder, we’re on the hunt for the holy grail of automated trading strategy. If you have any questions, start with the FAQs and if you still have questions, feel free to reach out to me (Celan) directly at AutomatedTradingStrategies@protonmail.com.
The Hunt for Alpha: Q1 2025 Forward Test Results
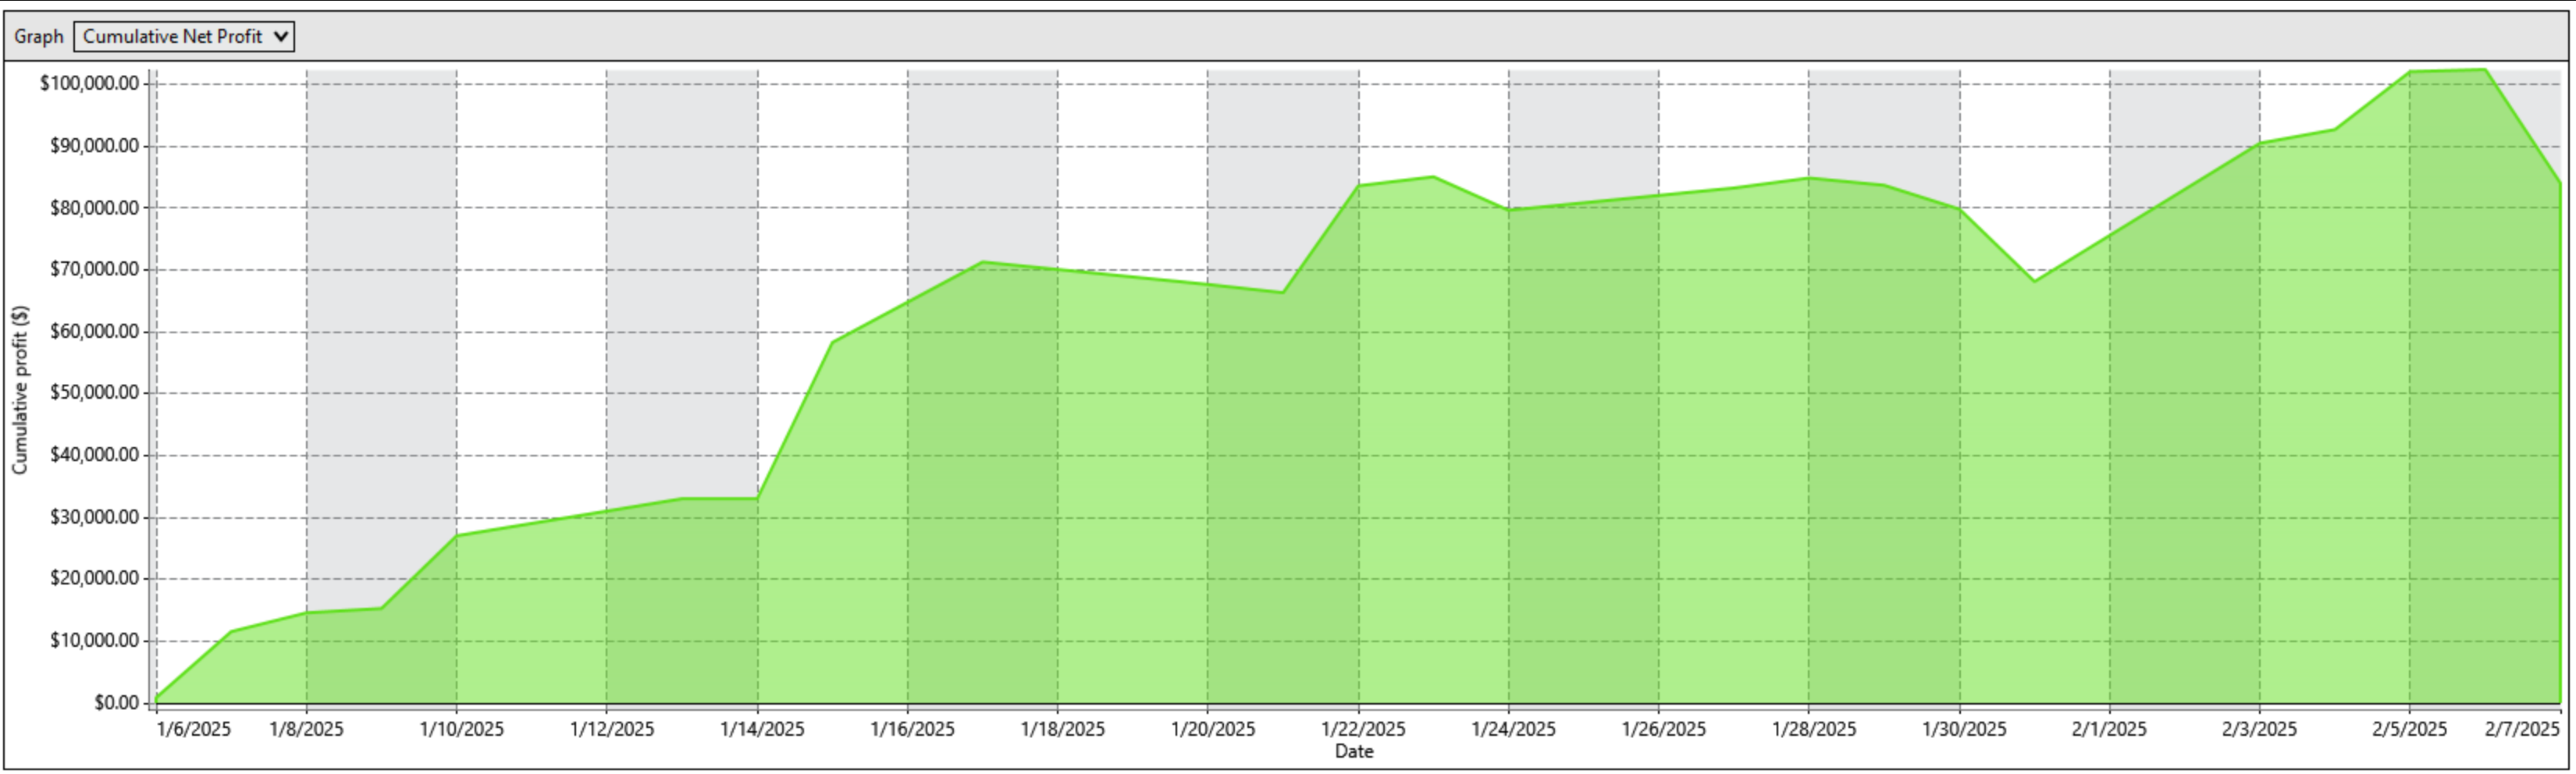
Alright traders, we just finished week 5 in a 10 week quarter. Here’s a performance chart of cumulative net income over the test period.
We're not playing with backtests and hypotheticals. This is live NT8 data, running in real-time through simulated accounts. Why does that matter? Forward testing separates the dreamers from the doers. Does it guarantee future performance? Hell no—nothing in trading does—but it puts the odds in your corner.
Here's what you need to know about the Q1 2025 forward test:
The Arsenal
19 battle-tested strategy variations
Built from 7 core money-makers
All running on 30+ minute charts
Instruments of choice: ES, NQ, HG, MNQ, ZB, YM, and RTY
The Evolution of The Forward Test
2023: Started getting serious with live forward testing
2024: Leveled up by tracking each variation (no more lumping strategies together). That led us to a few Champions that now comprise the Q1 2025 Forward Test Portfolio.
2025: The next step is to understand how we can gain more alpha through time based strategy selection, portfolio allocation and risk management. This Mudder Report is a first step in that effort.
So today we're answering the questions every trader asks, but few can answer with data:
"Got one day to trade? Here's when to show up."
"Only got two hours? Here's when to deploy."
"Can only run three strategies? Here's your weapons of choice."
We're about to dive into:
Raw performance numbers
Top guns by net profit
Strategy stacking opportunities
Negative correlations (perfect pairs trades)
Days that pay & time windows that print (when to push the boat out)
Ready to see where the real edge is hiding? Let's dive in...
Overall Performance

Total Trades: This is an active, intraday system. There are 113 trades in the period. That’s an average of roughly 3–4 trades per day.
Net Profit & Average Trade: The final net profit at 113 trades is $84,061. That works out to roughly $84,061 ÷ 113 ≈ $743 per trade on average.

Win/Loss Breakdown: 67% win rate (76/113 ≈ 67%) and a 33% loss rate.
Instrument Mix: The bulk of the trading is on NQ (NASDAQ E‐mini) and its cousin MNQ (micro NQ). There are also trades in ES (S&P 500 E–mini), YM (the Dow futures), RTY (Russell 2000), HG (Copper) and ZB (10yr)
Strategy Performance by Net Profit:
