

From Codebreaking to Market Mastery: How Jim Simons Used Markov States To Find Hidden Patterns
Using dependent, sequential states to find high probability trades
Important: There is no guarantee that ATS strategies will have the same performance in the future. I use backtests and forward tests to compare historical strategy performance. Backtests are based on historical data, not real-time data so the results shared are hypothetical, not real. Forward tests are based on live data, however, they use a simulated account. Any success I have with live trading is untypical. Trading futures is extremely risky. You should only use risk capital to fund live futures accounts and if you do trade live, be prepared to lose your entire account. There are no guarantees that any performance you see here will continue in the future. I recommend using ATS strategies in simulated trading until you/we find the holy grail of trade strategy. This is strictly for learning purposes.
We're not just developing strategies—we're on a quest for the holy grail of automated trading. Questions? Check the FAQs or feel free to reach out directly: AutomatedTradingStrategies@protonmail.com.
We’re on the hunt for the holy grail of automated trading strategies. A big part of that hunt is gaining a better understanding for how markets move. This is what we know:
markets are characterized by a large volume of transactions: the NYSE alone processes 3-6 billion shares daily. The S&P 500 makes millions of trades per day across 500 stocks. Forex makes billions of individual trades, $7 trillion daily volume.
markets have thousands of repeated “trials”: 252 trading days per year, 23,400 seconds per day (6.5 hours × 60 minutes × 60 seconds), each day/hour/minute is a repeated "experiment".
markets have many participants: 60+ million Americans own stocks, thousands of institutions, millions of algorithmic trades.
Every price tick is an event. Each tick is the market's "vote" on value.
At the trader level:
One trader's decision may seem unpredictable
One stock's movement is noisy
One day's action appears random
But in aggregate (large numbers), patterns start to emerge.
Enter the Law of Large Numbers. In probability theory, the Law of Large Numbers is a mathematical law that states that the average of the results obtained from a large number of samples converges to the true value, if it exists.
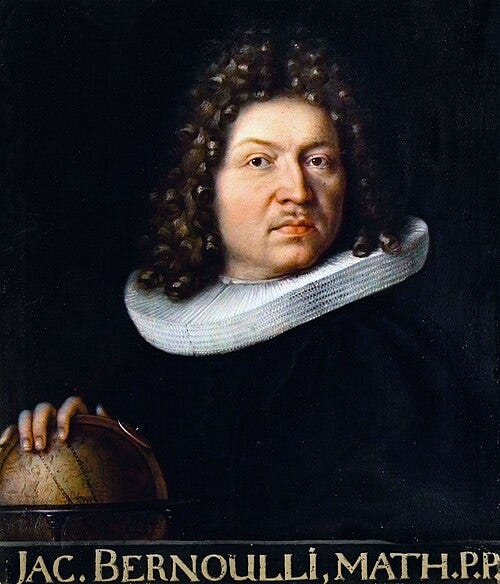
The theory is credited to the Swiss mathematician Jakob Bernoulli, who first proved it in 1713.
In 1902, Pavel Alekseevich Nekrasov used the theory in an attempt to prove the existence of free will.
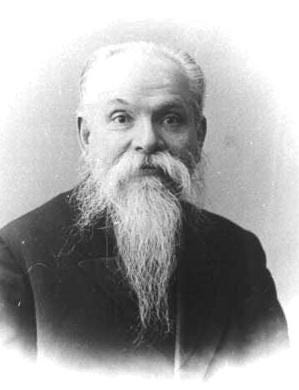
His logic? If independent events (like coin flips) follow predictable patterns, then human decisions, being independent due to free will, should also follow these patterns. These patterns were in essence a mark of God.
Nekrasov analyzed social data like crime rates and marriage statistics, showing that they followed predictable patterns. To him, this was proof: humans making "free" choices still created order, just like independent coin flips.
"God gave us free will," Nekrasov argued, "and mathematics proves it!"
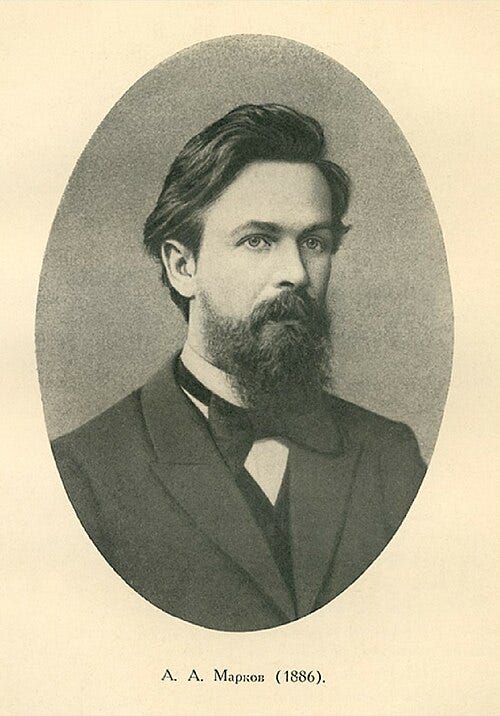
Another mathematician named Andrey Markov heard about this theory and essentially said: "Hold my vodka."
He knew Nekrasov had made a critical error. The Law of Large Numbers doesn't require independence—it only requires stable probabilities. To prove this, he needed an example where:
Events were clearly dependent (not independent like coin flips)
The Law of Large Numbers still applied
So, in 1913, Markov analyzed 20,000 letters from Alexander Pushkin's epic poem Eugene Onegin. He wasn't looking for meaning—he was tracking vowels and consonants. He found that:
After "q", you almost always get "u" (dependent)
After "th", you often get "e" (dependent)
After a consonant, you usually get a vowel (dependent)
The probability of a vowel appearing was 43.2% (8,638 vowels out of 20,000 letters)
After a vowel, another vowel appeared only 12.8% of the time
After a consonant, a vowel appeared 66.3% of the time
In other words, these letters followed the Law of Large Numbers, but they were not independent. The letters were clearly dependent on what came before.
Even more interesting, dependence often created even stronger, more predictable patterns than independence. Markov proved that dependent events could be just as predictable as independent ones, if not more.
This destroyed Nekrasov's argument and confirmed something that technical analysts have always known: markets have patterns.
But it wasn’t just the argument that was destroyed, it was the way in which traditional probabilities are calculated. By solving this problem, Markov had unknowingly created a new framework for solving a problem that would plague data analysts for the next century: How do you find patterns in datasets too large for traditional probability calculations?
Consider what Markov was facing with 20,000 letters:
2-letter combinations: 400 possibilities (20 × 20 for just consonant/vowel)
3-letter sequences: 8,000 possibilities
10-letter sequences: Over 10 billion possibilities
Traditional probability required calculating every possible combination. Instead, Markov created a way to hack the code. He compressed the complexity of the market into a simple 2×2 transition matrix.
And I want to point out that Markov didn't just solve a computational problem—he discovered that most information in sequences is local. For example, to predict tomorrow's weather, you need:
Today's weather: 80% of the information
Last week's weather: 15% more information
Last year's weather: 5% more information
Weather from 1823: 0% additional information
Well, you don’t really need that last one, but that’s the point. Markets work similarly. The current state contains the most predictive information. This also supports my view that strategy and indicator performance is primarily driven by the most recent data, this includes forward and backtest performance. In other words, the most recent data should be weighted higher than data from 5 years ago.
Now, you may be asking: that’s great for the early 1900’s, but don’t we have enough compute to solve these questions today?
The answer is of the “Yes, but…” variety.
Even with modern supercomputers, the numbers are still crazy. Track just 10 price levels (up/down) over 20 days:
Possible sequences: 2^20 = 1 million paths
Add volume (10 levels): 10^20 paths
Add 5 indicators: 10^100 paths
Add 500 stocks: 10^50,000 paths
The number of atoms in the universe is "only" 10^80.
And there’s another issue. Unlike physics, markets are:
Reflexive (predictions change outcomes)
Adaptive (strategies stop working when discovered)
Human-driven (psychology isn't probabilistic)
Markov chains work because they model markets as they actually are:
True probabilities don't exist
Local information dominates
Patterns matter more than exact sequences
Adaptation beats calculation
Unlike a coin flip where we know the probabilities converge on 50/50, we don’t really know what the “true” probability is that SPY will go up tomorrow. It's not a physics problem with fixed probabilities. Market probabilities are emergent from millions of decisions. They're constantly changing so there's no "ground truth" to calculate. Likewise, Markov models adapt as transitions evolve. This is why Markov Chains are even more powerful today than they were 100 years ao. The more data we have, the more powerful they become.
What Exactly IS a Markov Chain?
Here's where Markov's poetry analysis becomes a trader's best friend. A Markov chain is a sequential system that shows:
All possible states (Uptrend, Downtrend, etc.)
The transition rules (the matrix)
Initial conditions (where you start)
The actual evolution over time
The transition matrix provides the rules of the game. They don’t change.
Think of it like this: you're driving and approach a traffic light. Whether it turns green doesn't depend on the last 10 lights you hit—only whether it's currently red or yellow. That's the "memory-less" property in this system. And you can determine the probability of one light turning to another color by creating a Markov chain.
What if market behavior follows similar patterns? What if today's market state (trending up, consolidating, falling) could predict tomorrow's with measurable probability—regardless of how we get there? This is the billion-dollar question Markov accidentally provided an answer to.
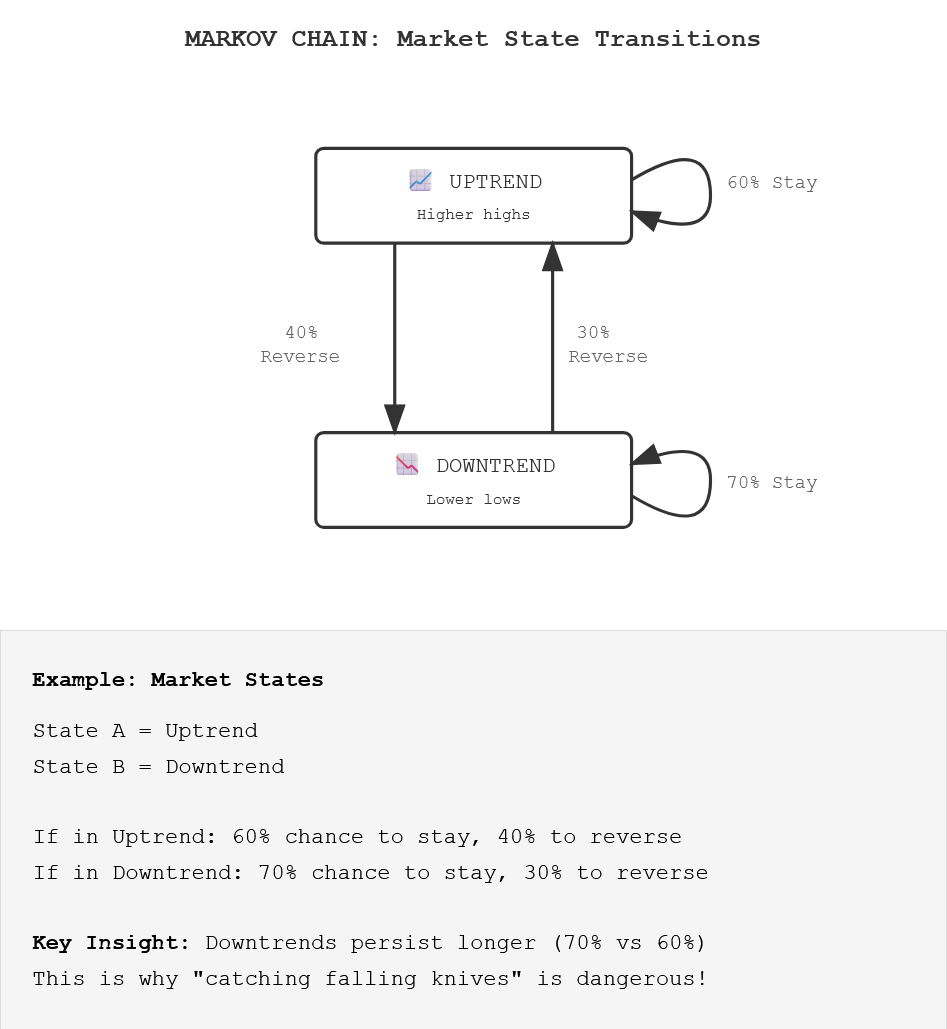
Here’s an example of a “chain” that shows the probability of moving from:
State A to State A (60%)
State A to State B (40%)
State B to State B (70%)
State B to State A (30%).
And this is the transition matrix that sets the rules for this chain:
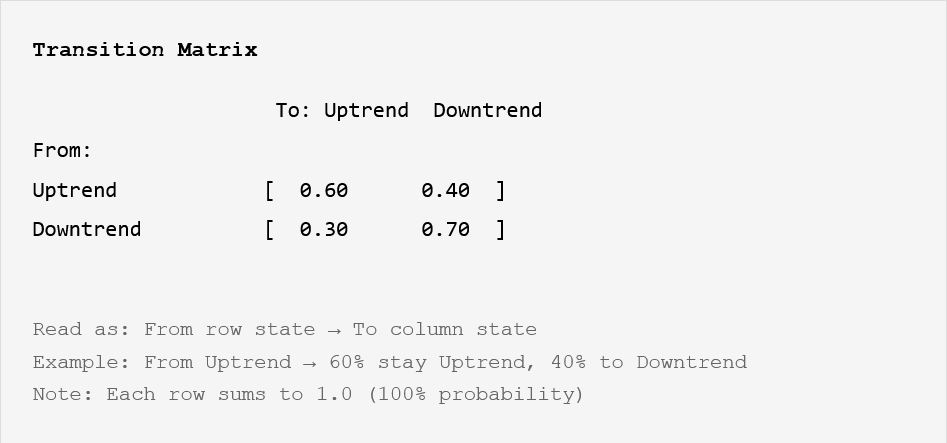
Instead of tracking every possible sequence over the last year, Markov chains only need:
The current state
Transition probabilities to the next state (transition matrix)
Let’s take it one step further.
Hidden Markov Chains
Here's where it gets fascinating. In traditional Markov chains (like Markov's vowel/consonant analysis), you can directly observe the states:
You SEE a vowel or consonant
You KNOW which state you're in
You can directly count transitions
Hidden Markov Chains or Models (HMMs) assume the REAL states are invisible, and you only see their symptoms. It suggests that there are essentially two layers to reality:
The Hidden Layer: The true state (invisible)
The Observable Layer: What those states produce (visible)
For example, hidden market states include:
smart money accumulating
distribution phase
short squeeze building
panic selling
Observable States include:
price up 2%
volume spike
volatility increase
bid-ask spread widening
The key difference is inference versus observation.
Traditional Markov: "Price went up, so we're in an uptrend"
HMM: "Price went up with declining volume and narrowing breadth, so we're probably in 'Distribution Phase' even though price is rising"
The HMM sees beyond the obvious to the hidden dynamics driving the market.
"I looked at the price charts and analyzed them, and they didn't look random to me. They looked kind of random, but not completely random."
Jim Simons
For markets, where big players hide their intentions and true dynamics are obscured, HMMs are the best use case for Markovian theory. They're the difference between trading what you see and trading what's actually happening. Hidden Markov Models (HMMs) assume something every veteran traders knows, there are invisible states driving visible outcomes.
Here’s another example using hidden states centered around the accumulation/distribution cycle.
Hidden Markov Model - Market Example

HIDDEN STATES (What's Really Happening):
┌─────────────────┐  ┌─────────────────┐  ┌─────────────────┐
│  Accumulation   │  │  Distribution   │  │   Capitulation  │
│  (Smart Money   │  │  (Smart Money   │  │   (Panic        │
│   Buying)       │  │   Selling)      │  │    Selling)     │
└────────┬────────┘  └────────┬────────┘  └────────┬────────┘
         │                    │                     │
         ↓                    ↓                     ↓
OBSERVABLE STATES (What We See):
┌─────────────────┐  ┌─────────────────┐  ┌─────────────────┐
│  Gradual Rise   │  │  Volatile Top   │  │  Sharp Decline  │
│  Low Volume     │  │  High Volume    │  │  Extreme Volume │
└─────────────────┘  └─────────────────┘  └─────────────────┘
Institutional Accumulation: Big money quietly building positions (hidden) → gradual price rise (visible)
Distribution Phase: Smart money selling to retail (hidden) → volatile tops (visible)
Fear Cycle: Underlying panic spreading (hidden) → sharp selloffs (visible)
Greed Cycle: FOMO building beneath surface (hidden) → parabolic moves (visible)
The genius of HMMs is that they can infer these hidden states from observable price patterns found in extremely large data sets. This is why Markov chains were used for:
The Manhattan Project: Stanislaw Ulam and John von Neumann developed Monte Carlo simulations using Markov chain principles to model neutron diffusion.
Google PageRank: Brin and Page modeled web surfing as a Markov process to rank page importance, beating out Yahoo!’s #1 algorithm at the time.
Large Language Models (LLMs): Modern AI uses sophisticated Markov-like processes to predict text.
These systems all involve sequences where the next state depends primarily on the current state—the "memory-less" property that makes Markov chains so powerful.
Another area where Markov chains proved essential was code-breaking.
Jim Simons: The Code-breaker Who Cracked the Market
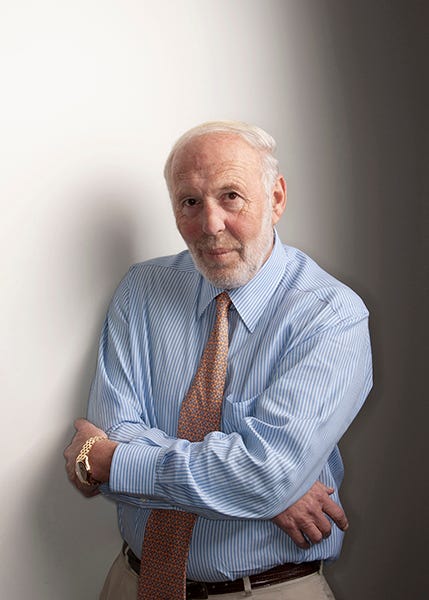
James Harris "Jim" Simons (1938-2024) was an American mathematician, code-breaker, and hedge fund manager. He founded Renaissance Technologies and created the most successful investment fund in history. How successful?
Renaissance Technologies (Medallion Fund)
66% average annual return (before fees, 1988-2023)
39% average annual return (after fees!)
Never had a losing year (except 1989, the first year)
Best year: +98.5% (2000)
Now compare that to Warren Buffett (Berkshire Hathaway):
20.1% average annual return (1965-2023)
Several down years including -43.7% (1974), -31.8% (2008)
Best year: +59.3% (1976)
Buffett is considered the greatest investor ever. Yet Renaissance outperformed Buffett by 3x annually. This isn't luck—it's the power of finding hidden patterns with mathematical models at scale.
Born in 1938 in Newton, Massachusetts, Simons was considered a child prodigy. At 20, he graduate from MIT with a bachelors in math, at 23 he graduated from UC Berkeley with a PHD in math. In 1964, he was recruited to work as a code-breaker for the Institute for Defense Analysis (IDA), which supported the NSA in code-breaking. This is where he met Leonard Baum, the creator of the Baum-Welch HMM algorithm. This algorithm could detect hidden patterns in any sequential data set—from speech to spy codes to stock prices. Baum would later be one of the first hires to Renaissance Technologies.
In 1968, Simons was fired from the IDA for publicly opposing the Vietnam War. That same year he became the Chairman of the Mathematics Department at Stony Brook University where he developed the Chern-Simons theory (1974) with S.S. Chern. It became one of the most cited papers in modern mathematics.
At age 40 he left academia and started using his knowledge of pattern recognition to trade currencies using mathematical models. He then founded Monemetrics (later Renaissance Technologies) in a strip mall —because nothing says 'future billionaire' like starting between a nail salon and a RadioShack—and the rest is history.
"I did a lot of math. I made a lot of money, and I gave almost all of it away."
Jim Simons
Simons died in 2024 at age 86 with a net worth of $31.4 billion.
His secret?
Applying the pattern-recognition skills from mathematics and code-breaking to financial markets. He didn't hire traders—he hired scientists who could find hidden patterns, whether in encrypted messages, speech patterns, or market prices.
"Patterns are not always obvious. But if you can find them, you can predict what will happen next."
Jim Simons
Encrypted messages and markets are similar—both look random, but contain hidden patterns. The skills for finding patterns in enemy communications translate directly to finding patterns in price movements:
Encrypted message → Market prices
Hidden state → Market regime
(enemy's intention) → (accumulation/distribution)
Decode probability → Predict next move
Pattern recognition → Pattern recognition
At the IDA, Simons learned that breakthrough insights come from:
Mathematicians talking to physicists
Code-breakers learning from linguists
Cross-pollination of ideas
He recreated this at Renaissance, hiring:
Speech recognition experts (Hidden Markov Model specialists)
Astronomers (pattern recognition in noisy data)
String theorists (multi-dimensional thinking)
The Evolution of “Markovian” Trading At Renaissance
Simons' unique contribution wasn't inventing new Markov mathematics—it was recognizing that:
Markets are like encrypted messages: Patterns hidden in noise
The Baum-Welch algorithm could find market regimes: Just like it found speech patterns
Scale matters: We need massive data for patterns to emerge (Law of Large Numbers)
His greatest insight? Markets aren't efficient random walks—they're inefficient Markov chains with learnable patterns.
Let’s take a look at how Renaissance evolved from HMM models to the most successful hedge fund in history. Here's the progression:
Phase 1: Basic Pattern Recognition (1978-1985)
Simple Markov Chains: Tracking state transitions in currencies
Mean Reversion: Basic "rubber band" strategies
Trend Following: Momentum-based systems
Key Learning: Even simple models could find inefficiencies
Phase 2: Hidden States Discovery (1985-1990)
Hidden Markov Models: Leonard Baum's algorithm implementation
Multi-State Systems: Beyond just "up" and "down"
Cross-Asset Patterns: Finding relationships between markets
Key Learning: What you can't see (hidden states) matters more than what you can
Phase 3: The Machine Learning Revolution (1990-2000)
Speech Recognition Experts: Hiring from IBM's Watson team
Pattern Matching at Scale: Thousands of potential signals tested
Non-Linear Relationships: Moving beyond simple transitions
Key Learning: More data + more compute = more alpha
Phase 4: The Modern Era (2000-Present)
Big Data Integration: Social media, satellite data, alternative datasets
Microsecond Execution: High-frequency implementations
Ensemble Methods: Combining hundreds of weak signals
Self-Correcting Models: Systems that adapt to regime changes
What We Can Learn: Each phase built on the previous one. Renaissance didn't abandon Markov chains—they enhanced them. We can follow this same path:
Start Simple: Basic state transitions (like Markov's vowels/consonants)
Add Hidden States: What's driving the visible patterns?
Scale with Technology: Use modern tools to test thousands of variations
Continuously Adapt: Markets evolve, so must our models
The Simons Legacy
While Renaissance keeps their current methods secret, Simons left us crucial insights: markets aren't just random walks or simple trends. They're complex state machines with hidden drivers. By identifying these states and their transition probabilities, traders can find edges invisible to those who only watch prices.
Today, Renaissance is likely using an ensemble of methods combining:
HMMs for regime detection
Kalman filters for smooth tracking
Deep learning for pattern recognition
Custom algorithms we can't even imagine
The poetry-analyzing atheist mathematician from Russia gave us the mathematical framework. The code-breaking genius from MIT showed us how to apply it. Now, we can build on their legacy.
Ready to take a deep dive on the psychology behind hidden states? Click here to read Part 2.
And I have a few treats coming down the pike for paid subscribers. As most of you know, I’m away from my desk for most of August, but when I return I’m going to use HMM to create a digital twin of my manual trading strategy (yes, I’ll be sharing my manual trading strategy with you as well).
I’ll also share my new favorite selection process for HWR strategies and we’ll start back up with the ML alert system, which is currently being tested (thank you Xa!). Xa is also running all forward tests for us so Ill have some updates for you when I get back. I am particularly interested in how the Grok 4 strategy is performing against the OpenAI Pro 3 and Claude Opus 4 strategy. Click here to download OpenAI 03, OpenAI 04 mini, Manus, Claude 3.7, Strategy 101 & Grok 3 for NT8. Strategy 101, a combination of the two best performing models, continues to do well.
You do NOT want to miss what’s coming in the fall.
If you have any questions/comments please send me an email: AutomatedTradingStrategies@protonmail.com.
One of the best writeups of this topic i have seen. The clarity and examples chosen have led to an easy to follow breakdown of the topic. Bravo!