Automated Trading Strategy #52
Today we’re introducing Strategy #52 on ATS, and Strategy #7 on ATS Mini.
There is no guarantee that any strategy will have the same performance in the future. Some may perform worse and some may perform better. We use backtests to compare historical strategy performance. Backtests are based on historical data, not live data. There are no guarantees that this performance will continue in the future. Trading futures is extremely risky. If you trade futures live, be prepared to lose your entire account. We recommend using our strategies in simulated trading until you/we find the holy grail of trade strategy.
For a link to all strategies and the most recent performance chart, click here.
Click on the table to enlarge.
As a quick reminder, our goal is to find the holy grail of automated trade strategy as defined below:
Profit factor greater than 3
Annual drawdown less than 3%
Annual return on max drawdown greater than 500%
Maximum daily net loss of -$1,000
Avg Daily profit greater than $1,000
Less than 5,000 trades annually
More than 253 trades annually
Today, we’re introducing Strategy 52 on ATS and Strategy 7 on ATS Mini.
Over the last 18 months we’ve learned a lot about automated trade strategy. We’ve learned what works and what doesn’t. Perhaps the hardest lesson of all — backtests aren’t always accurate. After all, without the backtest function, we would have to test all strategies live, which means we’d probably run out of time and money before finding the holy grail. I’m sure many similar expeditions have suffered this fate.
So, it is the backtest function that allows us to be on the hunt without getting killed. It is a kind of shield if used correctly.

We’ve used our mistakes to make us stronger. Every failure has been twisted into a lesson. Today, our strategies cater to the limitations and strengths of NT8’s backtest engine. That’s essentially what we’ve been doing over the last 4 months — developing a strategy for creating a strategy within a simulation. This has led to an appreciation for portfolio-based strategies that use multiple instruments over various time-based periods. In general, the longer the time period, the better. This is our shield within the backtest. We’ve found that it not only reduces alpha decay, but backtest risk as well.
In addition to a certain set of attributes that improve performance, we’ve also found that certain strategic concepts work better than others. In particular, strategies that exploit the extremes. In other words, we’ve noticed that strategies that signal orders in extreme trading conditions tend to perform better over time. They also tend to perform well across multiple contracts. Since these strategies produce fewer trade signals, the use of multiple contracts increases the diversification of trades, which reduces risk.
We’re publishing Strategy 52 as a portfolio based on 10 contracts:
6B - British Pound, 29 minutes
6E - Euro, 65 minutes
CC - Cocoa, 44 minutes
CL - Crude Oil, 58 minutes
ES - E-Mini S&P 500, 49 minutes
GE - Eurodollar, 35 minutes
HG - Copper, 43 minutes
KC - Coffee, 41 minutes
NQ - E-Mini NASDAQ 100, 60 minutes
ZN - 10Year Note, 27 minutes
Each instrument is optimized based on a minute based time series. The data series is the first number in the Parameters column. So the time series for 6B is 29 minutes, the time series for 6E is 65 minutes, the time series for CC is 44 minutes, and so on.
You can trade any of these contracts alone, i.e., only trade NQ, or together as a portfolio as we’ve done.
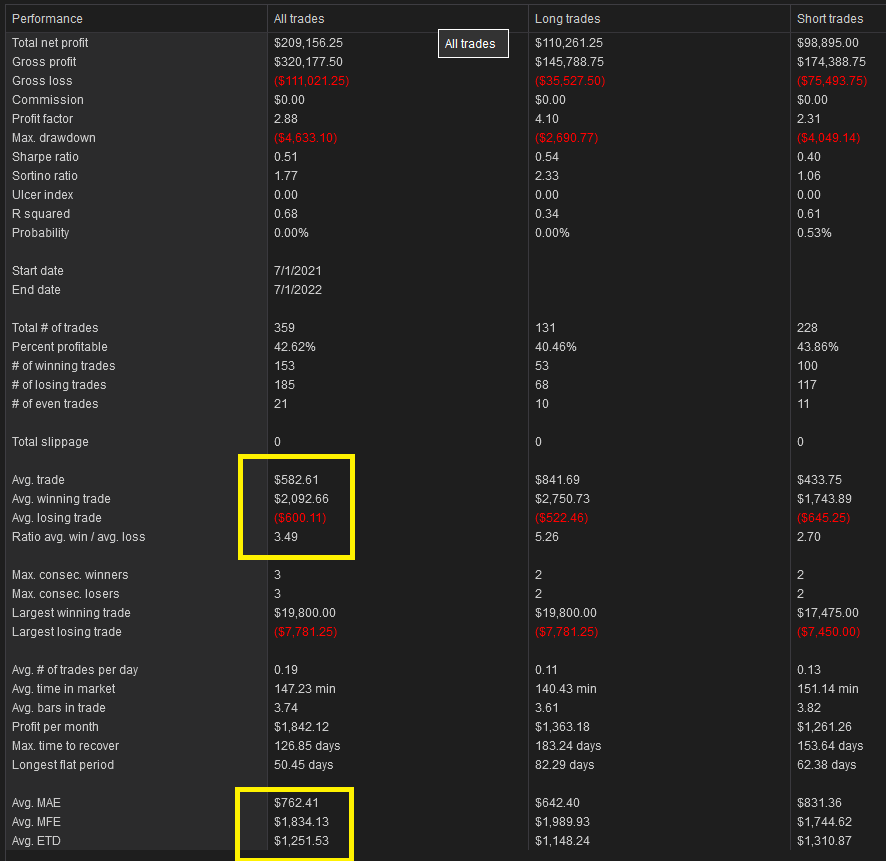
In total, there are 359 total trades with a net profit of $209K and profit factor of 2.88. You’ll also notice that the number of profitable trades is 42%, which is low. This is because Strategy 52 has an average win/loss ratio of 3.49. That means the average winning trade is 3.49x more than the average losing trade. Here’s a look at the performance summary:
You’ll notice the average losing trade is $600 while the average winning trade is $2,092. You’ll also notice that the Average MAE is $762 compared to an average MFE of $1,834 (for an overview of MAE, MFE statistics, click here). All together, this is telling us that this strategy is very good at cutting losses and increasing gains. I’ll talk about how and why that is in the strategy description.
Now, let’s get into how to recreate Strategy 52. I’ll also show you the command structure within Ninjatrader 8’s strategy builder. The strategy is also available for download (C#) below. Remember, you can test all strategies by duplicating our backtest results above and if you need help, just send me an email.
For links to all strategies available within the ATS subscription, click here.
For links to all strategies available within the ATS Mini subscription, click here.
Strategy 52 Description
Strategy 52 is a simple strategy. Our preliminary testing (standard backtests, market replay and live simulated) are very promising.


