The Mudder Report 3.0: 1/8/23 - 1/13/23 (Week 2)
New reporting methodology, Running 10 live tests on Apex, MAE vs Profit Factor, Walk-forward optimizations...
Important: There is no guarantee that our strategies will have the same performance in the future. We use backtests to compare historical strategy performance. Backtests are based on historical data, not real-time data so the results we share are hypothetical, not real. There are no guarantees that this performance will continue in the future. Trading futures is extremely risky. If you trade futures live, be prepared to lose your entire account. We recommend using our strategies in simulated trading until you/we find the holy grail of trade strategy.
As a quick review, the goal of the original Mudder Report was to provide a weekly tracking report of our best strategies (click here for links to all 60 strategies) based on historical or backtest data. The goal of the revised Mudder Report 3.0 is to provide weekly tracking for our best strategies based on real-time trade data. The trades are being made on a simulated account, but the data driving the simulation is live.
These are the real-time results for the time period January 1, 2023 to January 13, 2023:
Strategies 15, 2, 56, 56c and Portfolio BQ123 are positive so far this year. As a quick reminder, portfolio BQ123 is made up of strategies 4, 44, 50c1 and 57:
SimPortfolioBQ12 is a test for a portfolio strategy based on the strategy variations from the master equity futures portfolio with the highest percentage of profitable trades. This portfolio strategy was also successful in our Q4 real-time test. It also suggests that strategies 4 and 44 are profitable across multiple equity futures instruments.
I’ll be adding these strategies to our Apex interim forward-test.
Apex Interim Forward-test
In addition to focusing on cumulative net income over the forward-test period (instead of just the net income from the prior week), we’re also going to be tracking a few strategies on Apex. In this way, we’re using Apex in a dual capacity; it is both sandbox and potential funding partner. It also provides another way to gain and share trade performance objectively.
If one of the strategies passes the evaluation, we’ll continue to run it through to the live test, however, it will continue to serve as a learning experience for the quarterly live test in April. These interim tests are meant to better gauge the best practices we should use for managing that test. In other words, the live test in April will be conducted under a specific framework that will be developed using information gathered with these interim tests.
We’re also investigating a potential opportunity to use the maximum adverse excursion (MAE) statistic as an optimization metric. We’re doing this for two reasons:
It lowers MAE, which should help to pass funding evaluations based on a fluid trailing drawdown.
It provides another viable way to diversify cash flows. In other words, if you have one strategy optimized by max profit factor and MAE, it might help to find a common path through the forest, particularly if you find two time series that overlap.
As a way to explain the logic, let me show you how we got here.
A few weeks ago I started using walk-forward optimizations to test a few ideas. The following shows the 7/1 walk-forward optimization for Strategy 60 based on optimizing profit factor. In other words, we’re asking the model to find the optimal time series based on a 7 day optimization period and then we’re using that time series to run the strategy on the following day. So, we have an optimization period of 7, and a test period of 1. When we did this over the time period 1/8/2023 to 1/13/2023, total net profit was $1,747 on 25 trades. These are the results:
And this is the break down by day with the associated time series:
As you can see from the Parameters section, the time series is always something higher than 14 minutes.
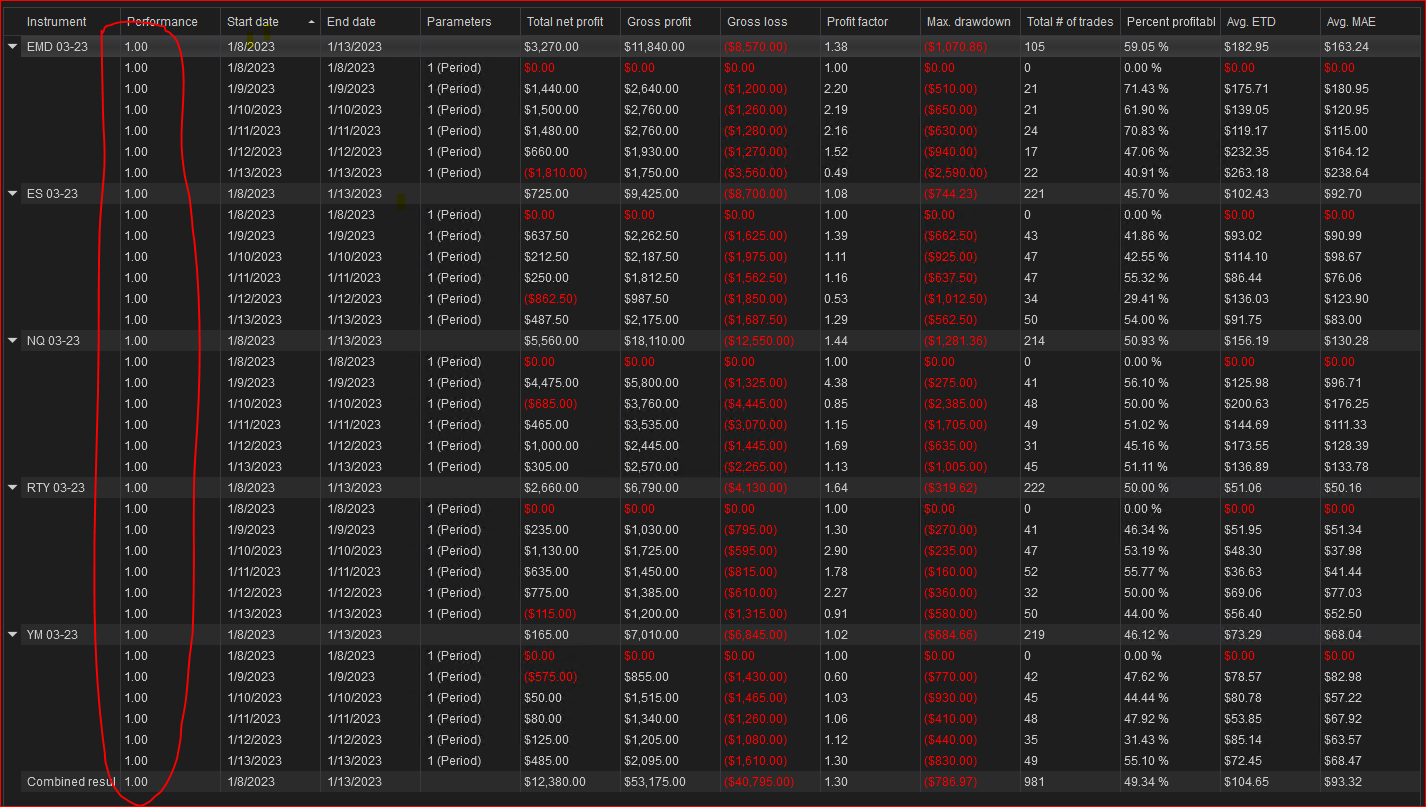
By contrast, the following shows the optimization based on optimizing the MAE instead of the profit factor using NT8s optimization tool. The total net profit over the same time period is ~6x higher at $12,380 on 981 trades.
And this is the breakdown by day.
As you can see, we go from multiple time series ranging from 14 to 52 minutes in the optimization based on profit factor, to a 1 minute data series across the board for optimizations based on MAE. The implication here is that there might be a not so obvious path to the holy grail by way of a low MAE.
I want to be clear, this doesn’t work with every strategy. This only works for strategies like Strategy 60 that rely on catching long price trends.
In order to reduce your volatility or MAE, you have to reduce the frequency of your time series. In other words, a 1 minute data series is always going to have a lower MAE than a 60 minute data series. So by focusing in on the time series that’s best for reducing the MAE, instead of profit factor, we’re using the strategy’s strength to our advantage. The conundrum is that performance results related to a higher frequency data series tend to be better; that is, the 60 minute data series is going to have a higher profit factor and fewer trades than the 1 minute data series.
The obvious next step is to retest all strategies using a 1 minute data series. Those strategies with positive results will be used as a way to test a new portfolio based on MAE optimized strategies. We’ll also be testing this strategy on both the virtual server as well as Apex.
These are the strategies I’ll be adding to the Apex live test this week:
Contact: AutomatedTradingStrategies@protonmail.com.


