The Mudder Report: 28 Mudder Strategies Survived Last Week's Sell-Off, And Some Thrived
"His mother was a mudder; his father was a mudder"
Important: There is no guarantee that ATS strategies will have the same performance in the future. I use backtests and forward tests to compare historical strategy performance. Backtests are based on historical data, not real-time data so the results shared are hypothetical, not real. Forward tests are based on live data, however, they use a simulated account. Any success I have with live trading is untypical. Trading futures is extremely risky. You should only use risk capital to fund live futures accounts and if you do trade live, be prepared to lose your entire account. There are no guarantees that any performance you see here will continue in the future (good or bad)—that’s what makes the hunt for the holy grail so difficult. This is why the best way to trade is with a simulated account on live data. I recommend using ATS strategies in simulated trading until you/we find the holy grail of trade strategy.
A mudder horse is defined by Merriam-Webster as:
1 : a race horse that runs well on a wet or muddy track.
I hope everyone is having a great summer! I’m getting in a lot of bird-watching and I’m definitely drinking too many strawberry milkshakes. The garden is doing very well this year—we just harvested some garlic and the cucumbers are on the verge of taking over! The most interesting development are some volunteer tomatillos. We don’t know where they came from, but I’m looking forward to making salsa.
I’m sure you’re as anxious as I was to know how the Q3 Forward Test Portfolio fared after the sell-off over the last two weeks. In particular, I’ll review:
which strategy variations performed well
which instruments performed well
how well AI-generated strategies performed ag. non-AI generated strategies
If you’re interested in starting your own forward test, click the button below.
In total, the portfolio did NOT perform well. In fact, it lost $750K in the month of July, after being up $500K in the first week. Here’s a breakdown by day:
What happened?
What happened is that after a big first week, weeks 2, 3 and 4 tanked. Since the portfolio is highly correlated with the market, especially AI generated strategies, it tends to be skewed toward an advancing market so the last two weeks were a test of sorts.
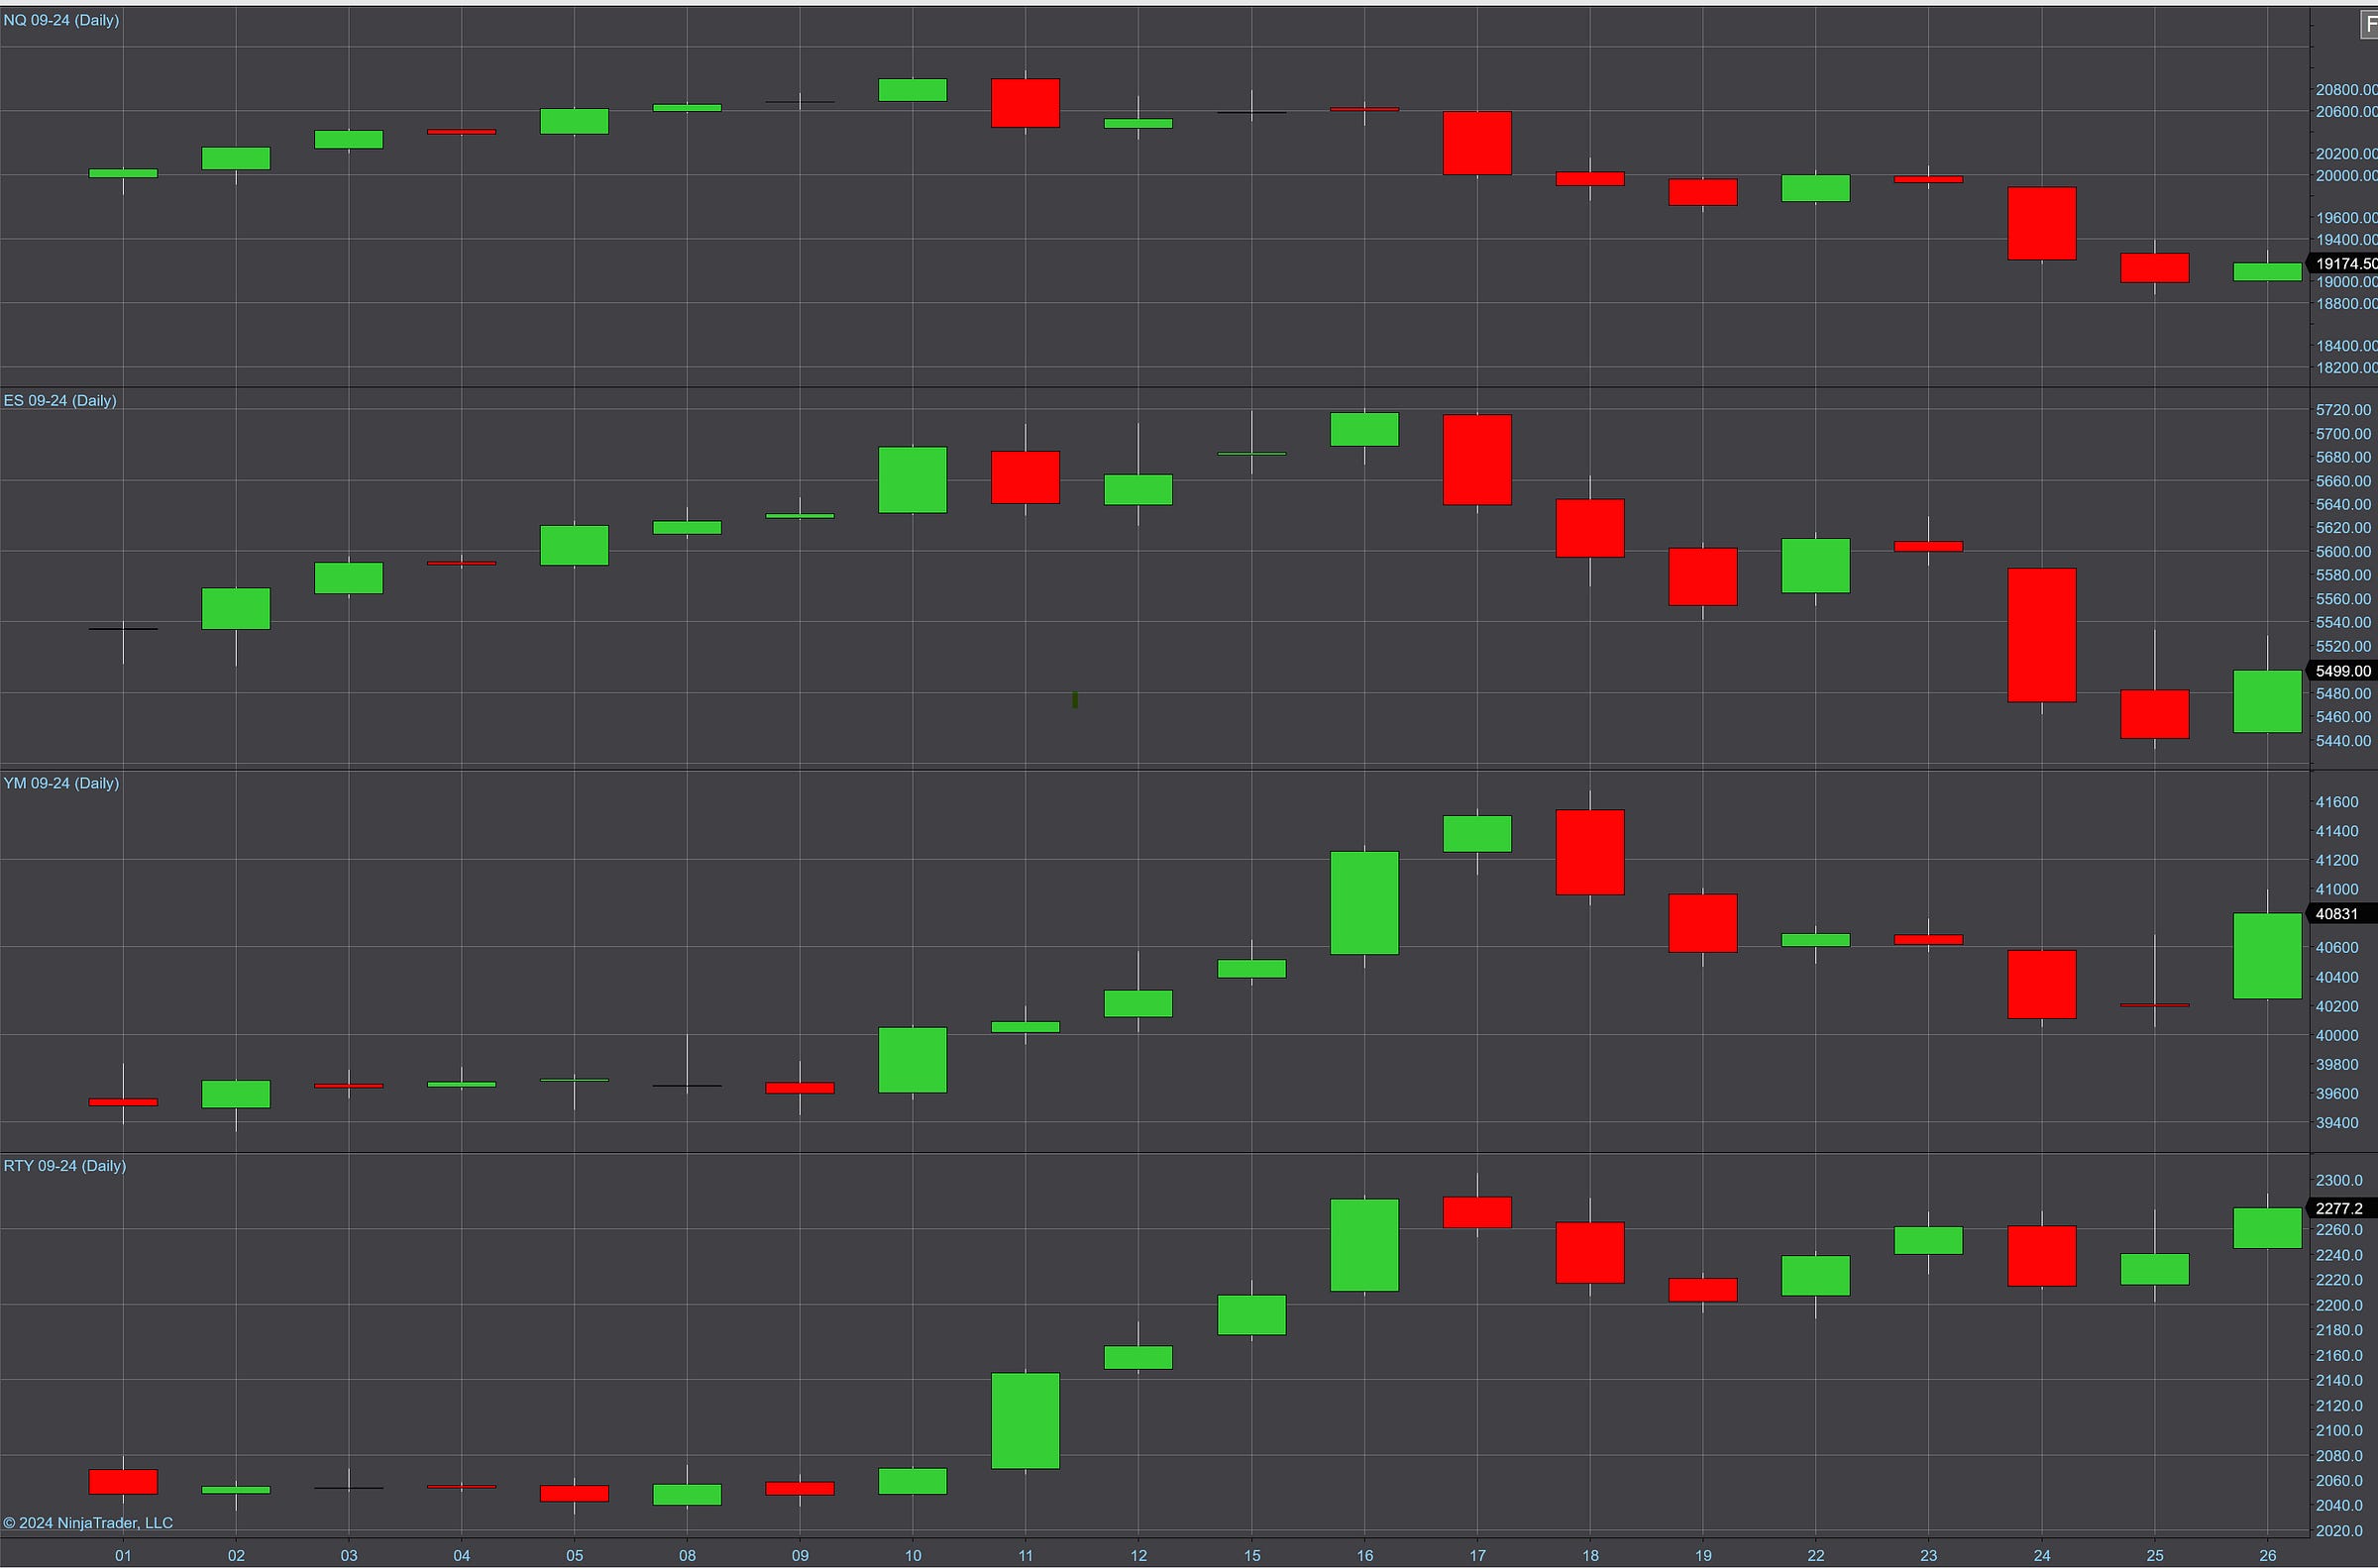
Indeed, last week included the worst performing day for the S&P 500 and the Nasdaq since 2022. Here’s a daily chart of the NQ, ES, YM and RTY over the same time period. It’s right around the 16th that the technical correction started to happen, which lines up with the chart above.
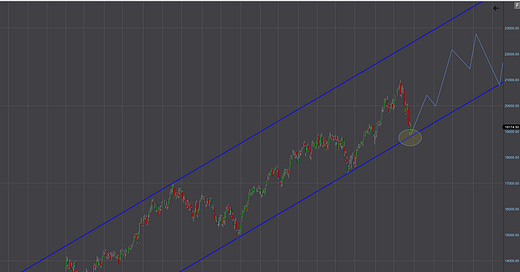
When I say technical correction, I mean that last week’s movement was within the long-term trend-lines. Here’s my latest daily NQ chart going back to November of 2022:
From a technical perspective, I think the correction is over, but it could also break-through support. The only way that happens is if the Fed says no rate decrease for the rest of the year. If anyone wants to make that bet, I’ll take that action. Otherwise, I think we’ve seen a bottom.
It may sound strange, but I couldn’t be happier about what happened over the last two weeks. One of the reasons I refer to this as The Mudder Report is because it reports on strategies that might be the foundation of a multi-strategy holy grail and/or a strategy with a highly adaptive command structure.
In the same way that a mudder horse does well on a rainy track, I’m on the hunt for a strategy that does well regardless of the market.
We know that almost all strategies in the portfolio perform well when the market goes up. Some do better than others. Likewise, some do better than others when the market goes down. With such a volatile and crazy month, the question is: which strategies were able to do both? I want to use what happened last week as a kind of performance filter to identify the true mudders.
What did I find?
Well, out of the 90+ strategy variations in the Q3 Forward Test, only 28 actually made more than $1K in July. One even made $15K. Click on the button below and scroll to the bottom for a spreadsheet with the strategy variations used in the Q3 Forward Test.
I know a few of you just signed up so it’s impossible to appreciate the level of detail captured in the current forward test. In the past, each strategy variation funneled into the same account, so we didn’t know which strategy variation (instrument, data series, parameters) performed well and which variations did not. Now we know the details and the results are truly insightful.
What’s really interesting is that certain strategies made the list more than once, which is a sign of strength. In fact, one strategy accounts for nine of the strategy variations on the list. I also love the number of non-NQ instruments on the list. In addition to NQ, we’ve got ES, GC, SI, YM, QO, and NG. I’m thrilled guys!
Ok, let’s get into it…


