We’ve got a lot going on this week.
The goal of the original Mudder Report was to provide a weekly tracking report of our best strategies. The data that populated the report came from weekly backtests rather than actual data, which led to poor decision making — to say the least.
The goal of the new and revised Mudder Report is to provide weekly tracking of our best strategies based on real-time trade data. The trades are being made on a simulated account, but the data driving the simulation is live.
So that’s the new process. We’re using backtests as a way to find strategies, then we test those strategies by running them on a virtual server located in Chicago. If the strategies pass the test for the week, they are included in the Mudder Report.
What does it mean to “pass the test”? It means real-time results are the same as backtest results. (If those words don’t make you want to shed a mental tear, you haven’t been on the hunt for very long.)
So, we’ve already greatly improved backtest accuracy by making a few changes to the development process, now we’re getting as close as we can to real life without ‘disengaging safety protocols’.
What are we hoping to learn in this latest venture?
What are we looking for in the Mudder Report?
What are my biggest concerns?
Ultimately, we’re trying to run our portfolio live, so we’re looking to answer some very specific questions with the Mudder Report before we do. In particular:
Is our optimization logic profitable? Preliminary results suggest that the way we’re optimizing strategies (based on time series rather than indicator parameter) does not lead to overfitting. Over the next 6 months we will be able to collect real-time information about the performance of portfolio strategies optimized in this method.
Are certain high volatility days more prone to backtest inaccuracy? If so, should we look into removing those days or should we use our highest performing strategy that plays to market extremes on these days?
How does drawdown work in a portfolio? One deficiency of NT8 is that it can only run strategies as separate instances rather than concurrently, so I don’t know how the strategies will impact total drawdown when run together. My hope is that it smooths out risk and lowers portfolio drawdown. I’m looking at several options to help understand what’s happening at the portfolio level, including an NT8 add-on with a very interesting portfolio filter. I’ll share the name of the application as well as the information it told us about total portfolio drawdown with subscribers below.
Are our strategies really uncorrelated? Another reason we wanted to diversify strategies, instruments and time series is because it diversifies trade opportunities, so I believe the portfolio is naturally uncorrelated (for the most part), but that is a huge assumption. We’ll be looking to see how many trades occur every week with the new portfolio analysis add-on as well.
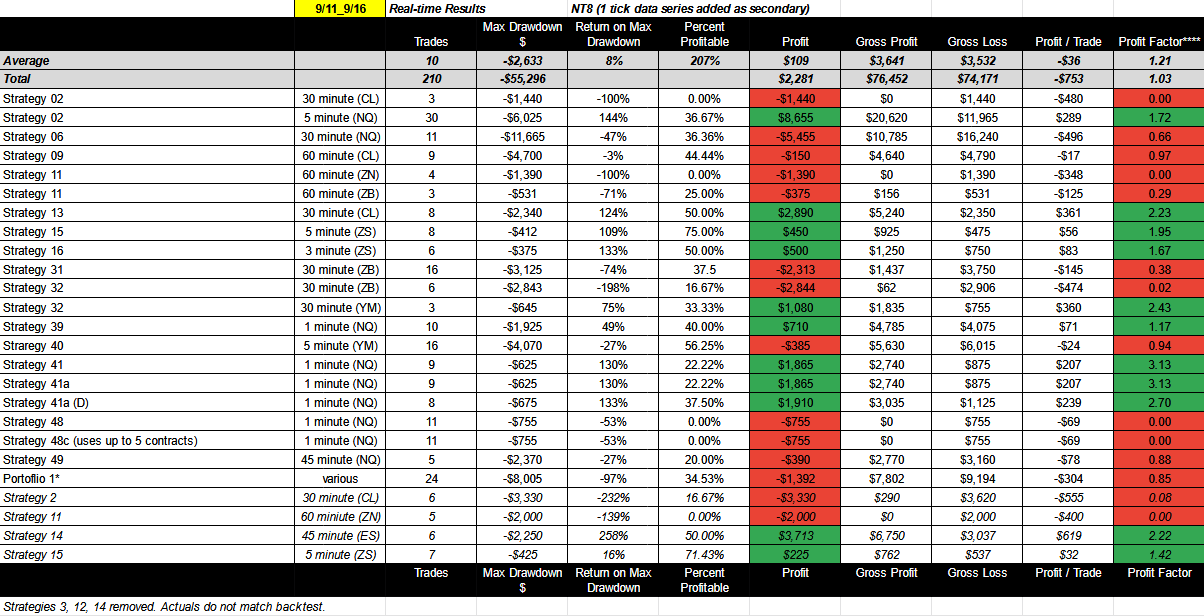
These are the results from the Mudder Report for last week:
These are the actual results of all strategies from last week and all 20 of these strategies had real-time strategy results that were in line with backtest results.
Strategy 2 did well with NQ.
Strategies 13, 15 and 16 also did well with CL, ZS and ZS, respectively.
It was a week of extremes so it’s not surprising that Strategy 41 and its variations did well.
Strategies 3, 12 and 14 were removed as single strategies because actual results did not perform like the backtest.
This gives more credibility to the annual backtest results of the strategies that passed. To view the most recent performance chart with annual backtest results, click here.
We’ll be tracking these strategies again next week and adding to the list. We are also tracking all strategies in the portfolios created with Strategy 54.
The goal of Strategy 54 was to create a master list of our best strategies for use in a live test in January. One way to prepare for that live test, as well as obtain possible funding for the live test, is to apply for funding with a funding partner.
Funding Partner Evaluation
In an attempt to learn more about the world of funding (something many of you have asked about) I am going to use one of our portfolio strategies to apply for funding. I want to see if it might serve as a tool for the hunt.
Which strategy/portfolio do we use?
Portfolio 54e - $201K net income, 4.93 profit factor, 8.76 weighted average profit factor, 535 trades
Portfolio 54f - $47K net income, 4.14 profit factor, 18.44 weighted average profit factor, 364 trades
Portfolio 54e is a list of the best strategies for each instrument. All strategies have a profit factor greater than 3 and made at least 20 round trades for the year:


