

Nasdaq Futures Violate Multi-Year Uptrend Channel: We May Be Entering A New Market Phase
Plus Q2 2025 Forward Test Results: Week 1
IMPORTANT DISCLAIMER: Past performance is no guarantee of future results. All backtests and forward tests represent hypothetical or simulated trading—not actual profits or losses. Trading futures carries extreme risk; only use capital you can afford to lose. Any success shown here is atypical. Be prepared for the possibility of losing your entire account. This content is strictly educational.
We're not just developing strategies—we're on a quest for the holy grail of automated trading. Questions? Check the FAQs first, then feel free to reach out directly: AutomatedTradingStrategies@protonmail.com.
*Not all strategies are included with the subscription. Click the button below for complete list of all strategies included with the subscription.
The recent price action in the Nasdaq-100 futures (NQ) deserves close attention. After nearly two years of steady climbing within a well-defined upward channel, we're seeing a significant technical breakdown that could signal a shift in market dynamics.
Looking at the daily chart spanning from early 2023 through March 2025, the NQ had established a remarkably consistent uptrend, bounded by parallel trendlines that contained price action through multiple rallies and corrections. This channel acted as guardrails for traders navigating the index, but those guardrails were violated in early March.
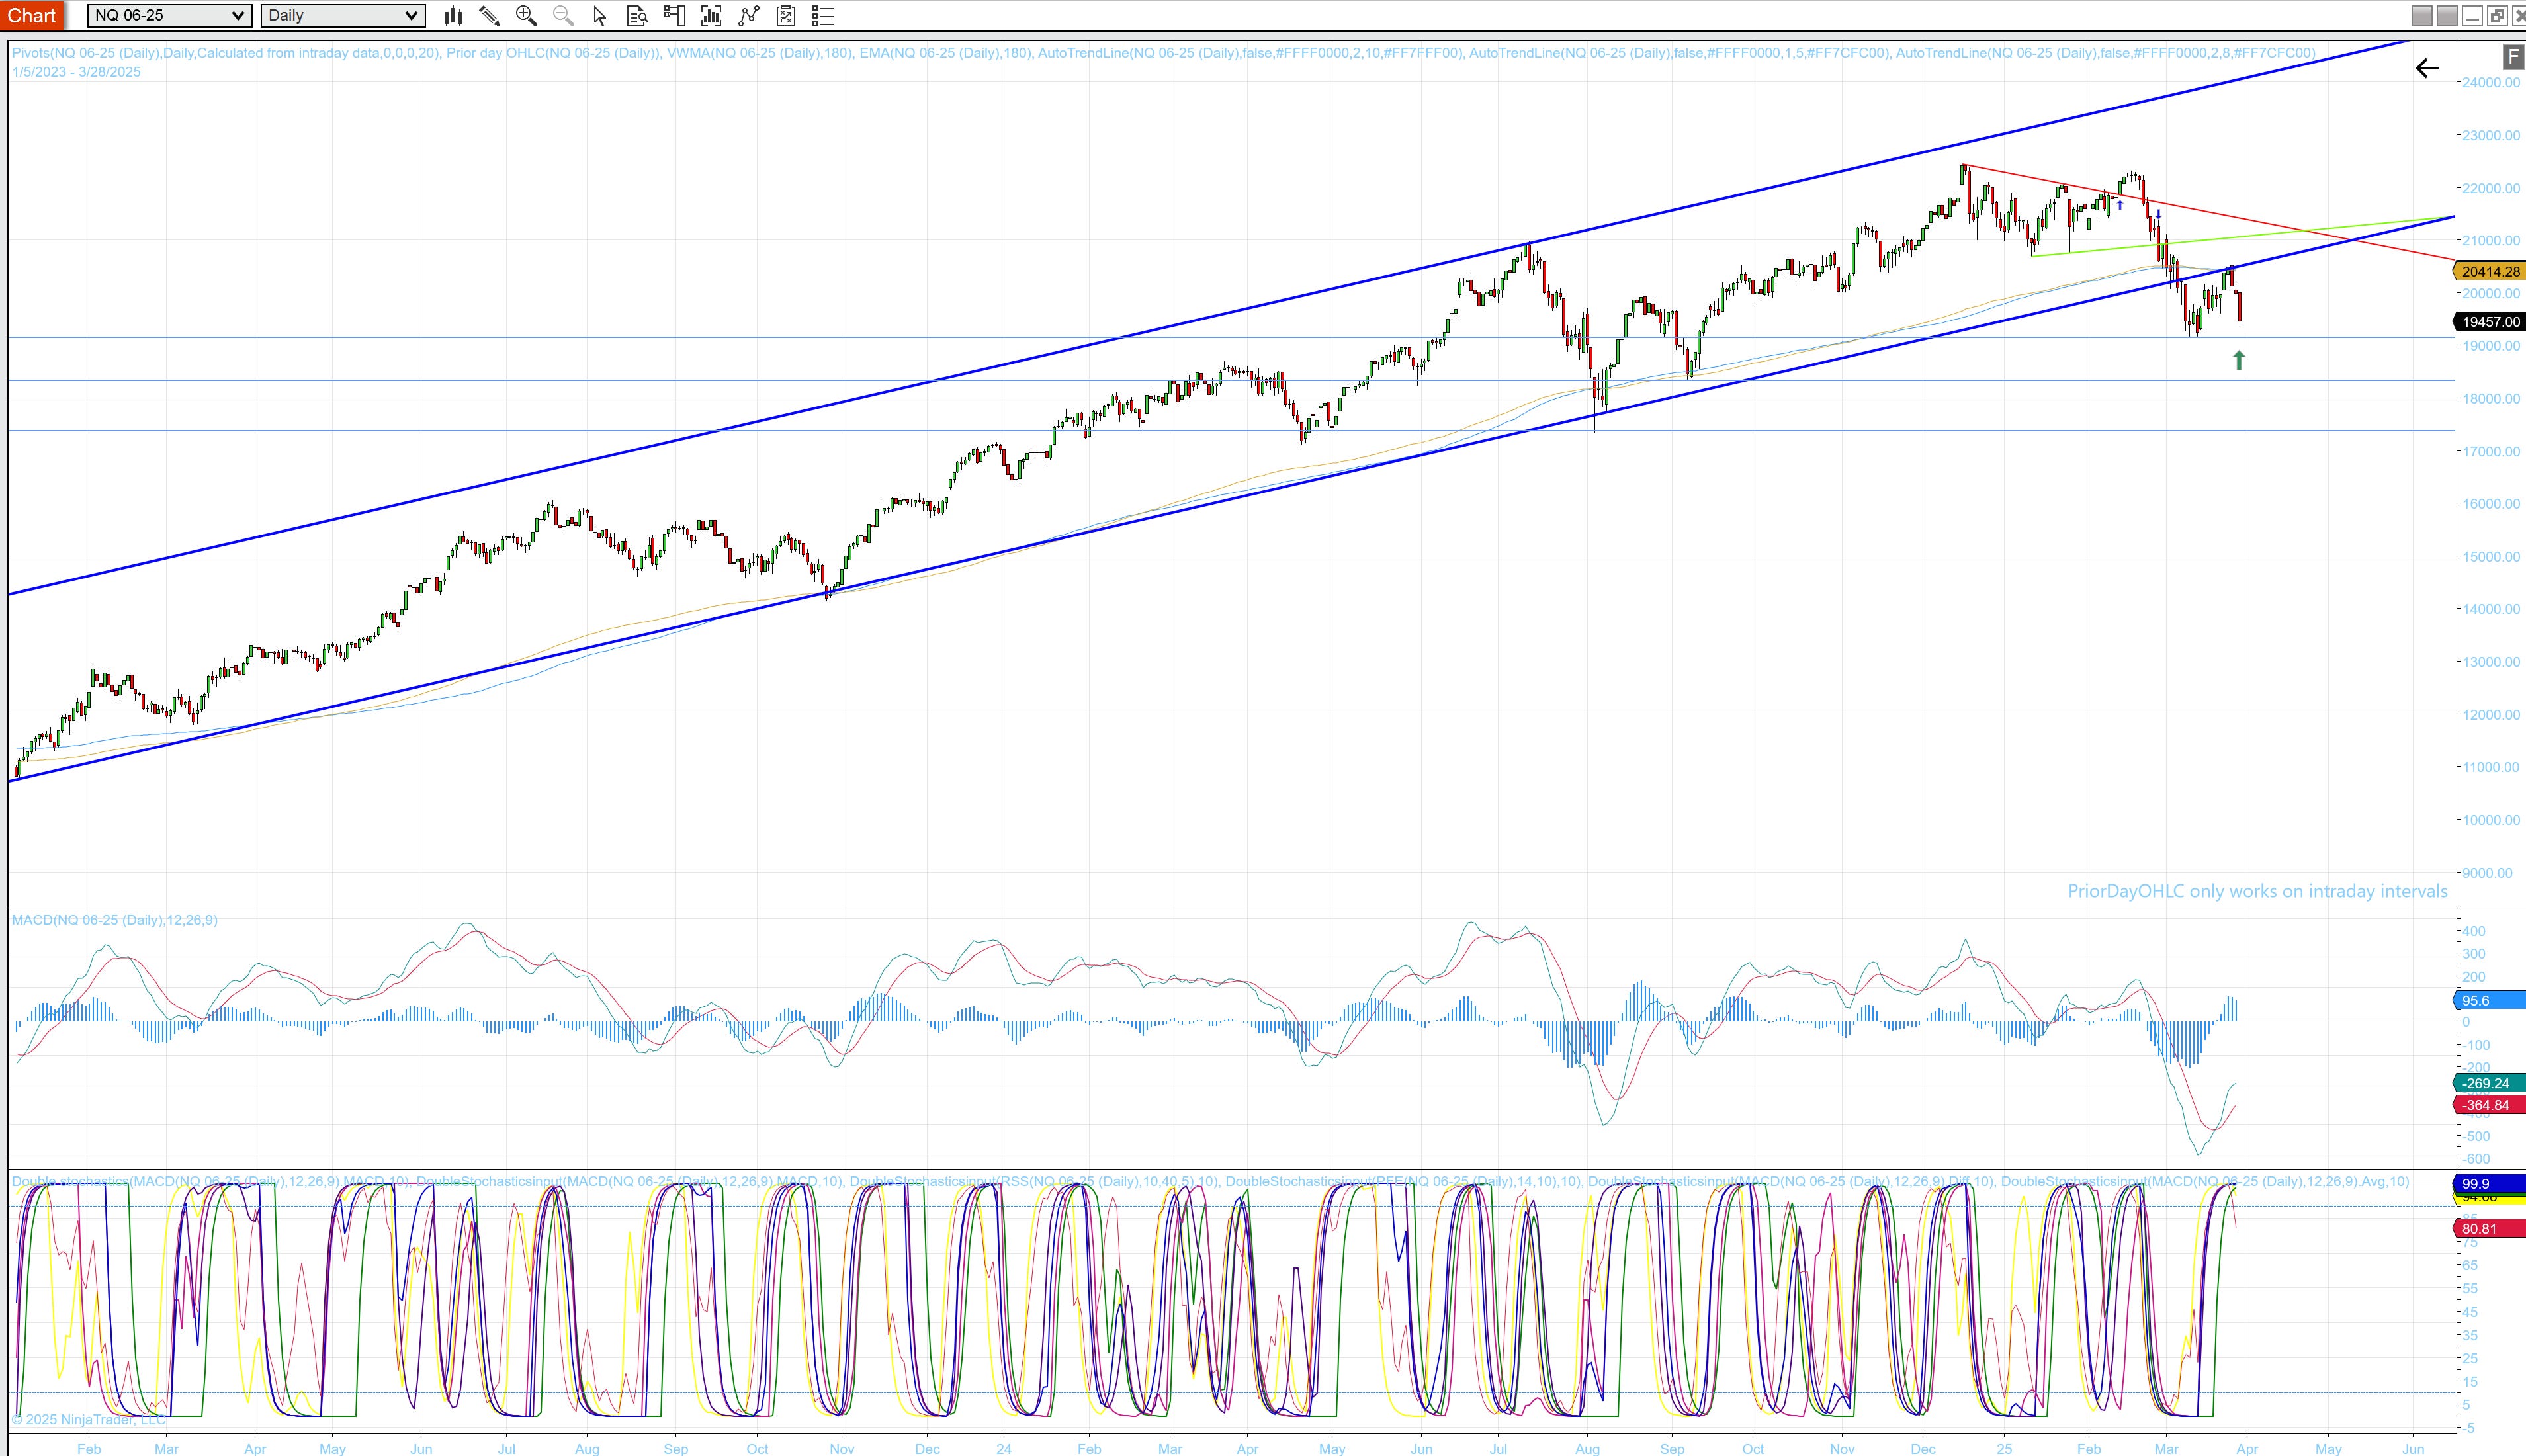
It is worth noting that this correction began as a typical retracement from the upper boundary and quickly accelerated into a more substantial decline, eventually breaching the lower support trendline that held firm for nearly two years.
Most telling is what happened next: rather than immediately bouncing higher, price retraced upward just enough to test the underside of the broken trendline before selling resumed. This "kiss goodbye" pattern, where former support transforms into resistance, is a classic bear signal that often confirms a meaningful trend change rather than a temporary correction.
The technical indicators support this bearish narrative, with momentum oscillators showing pronounced weakness despite the brief retracement attempt. This suggests that selling pressure remains dominant even after the initial breakdown.
What does this mean for us traders?
The violation of such a long-standing uptrend channel indicates we may be entering a new market phase that requires adjusted strategies. The failed retest of the trendline provides a clear reference point for risk management, while also suggesting that the path of least resistance may now be downward rather than upward. I’ve added a green trendline to the chart below to show the downtrend.
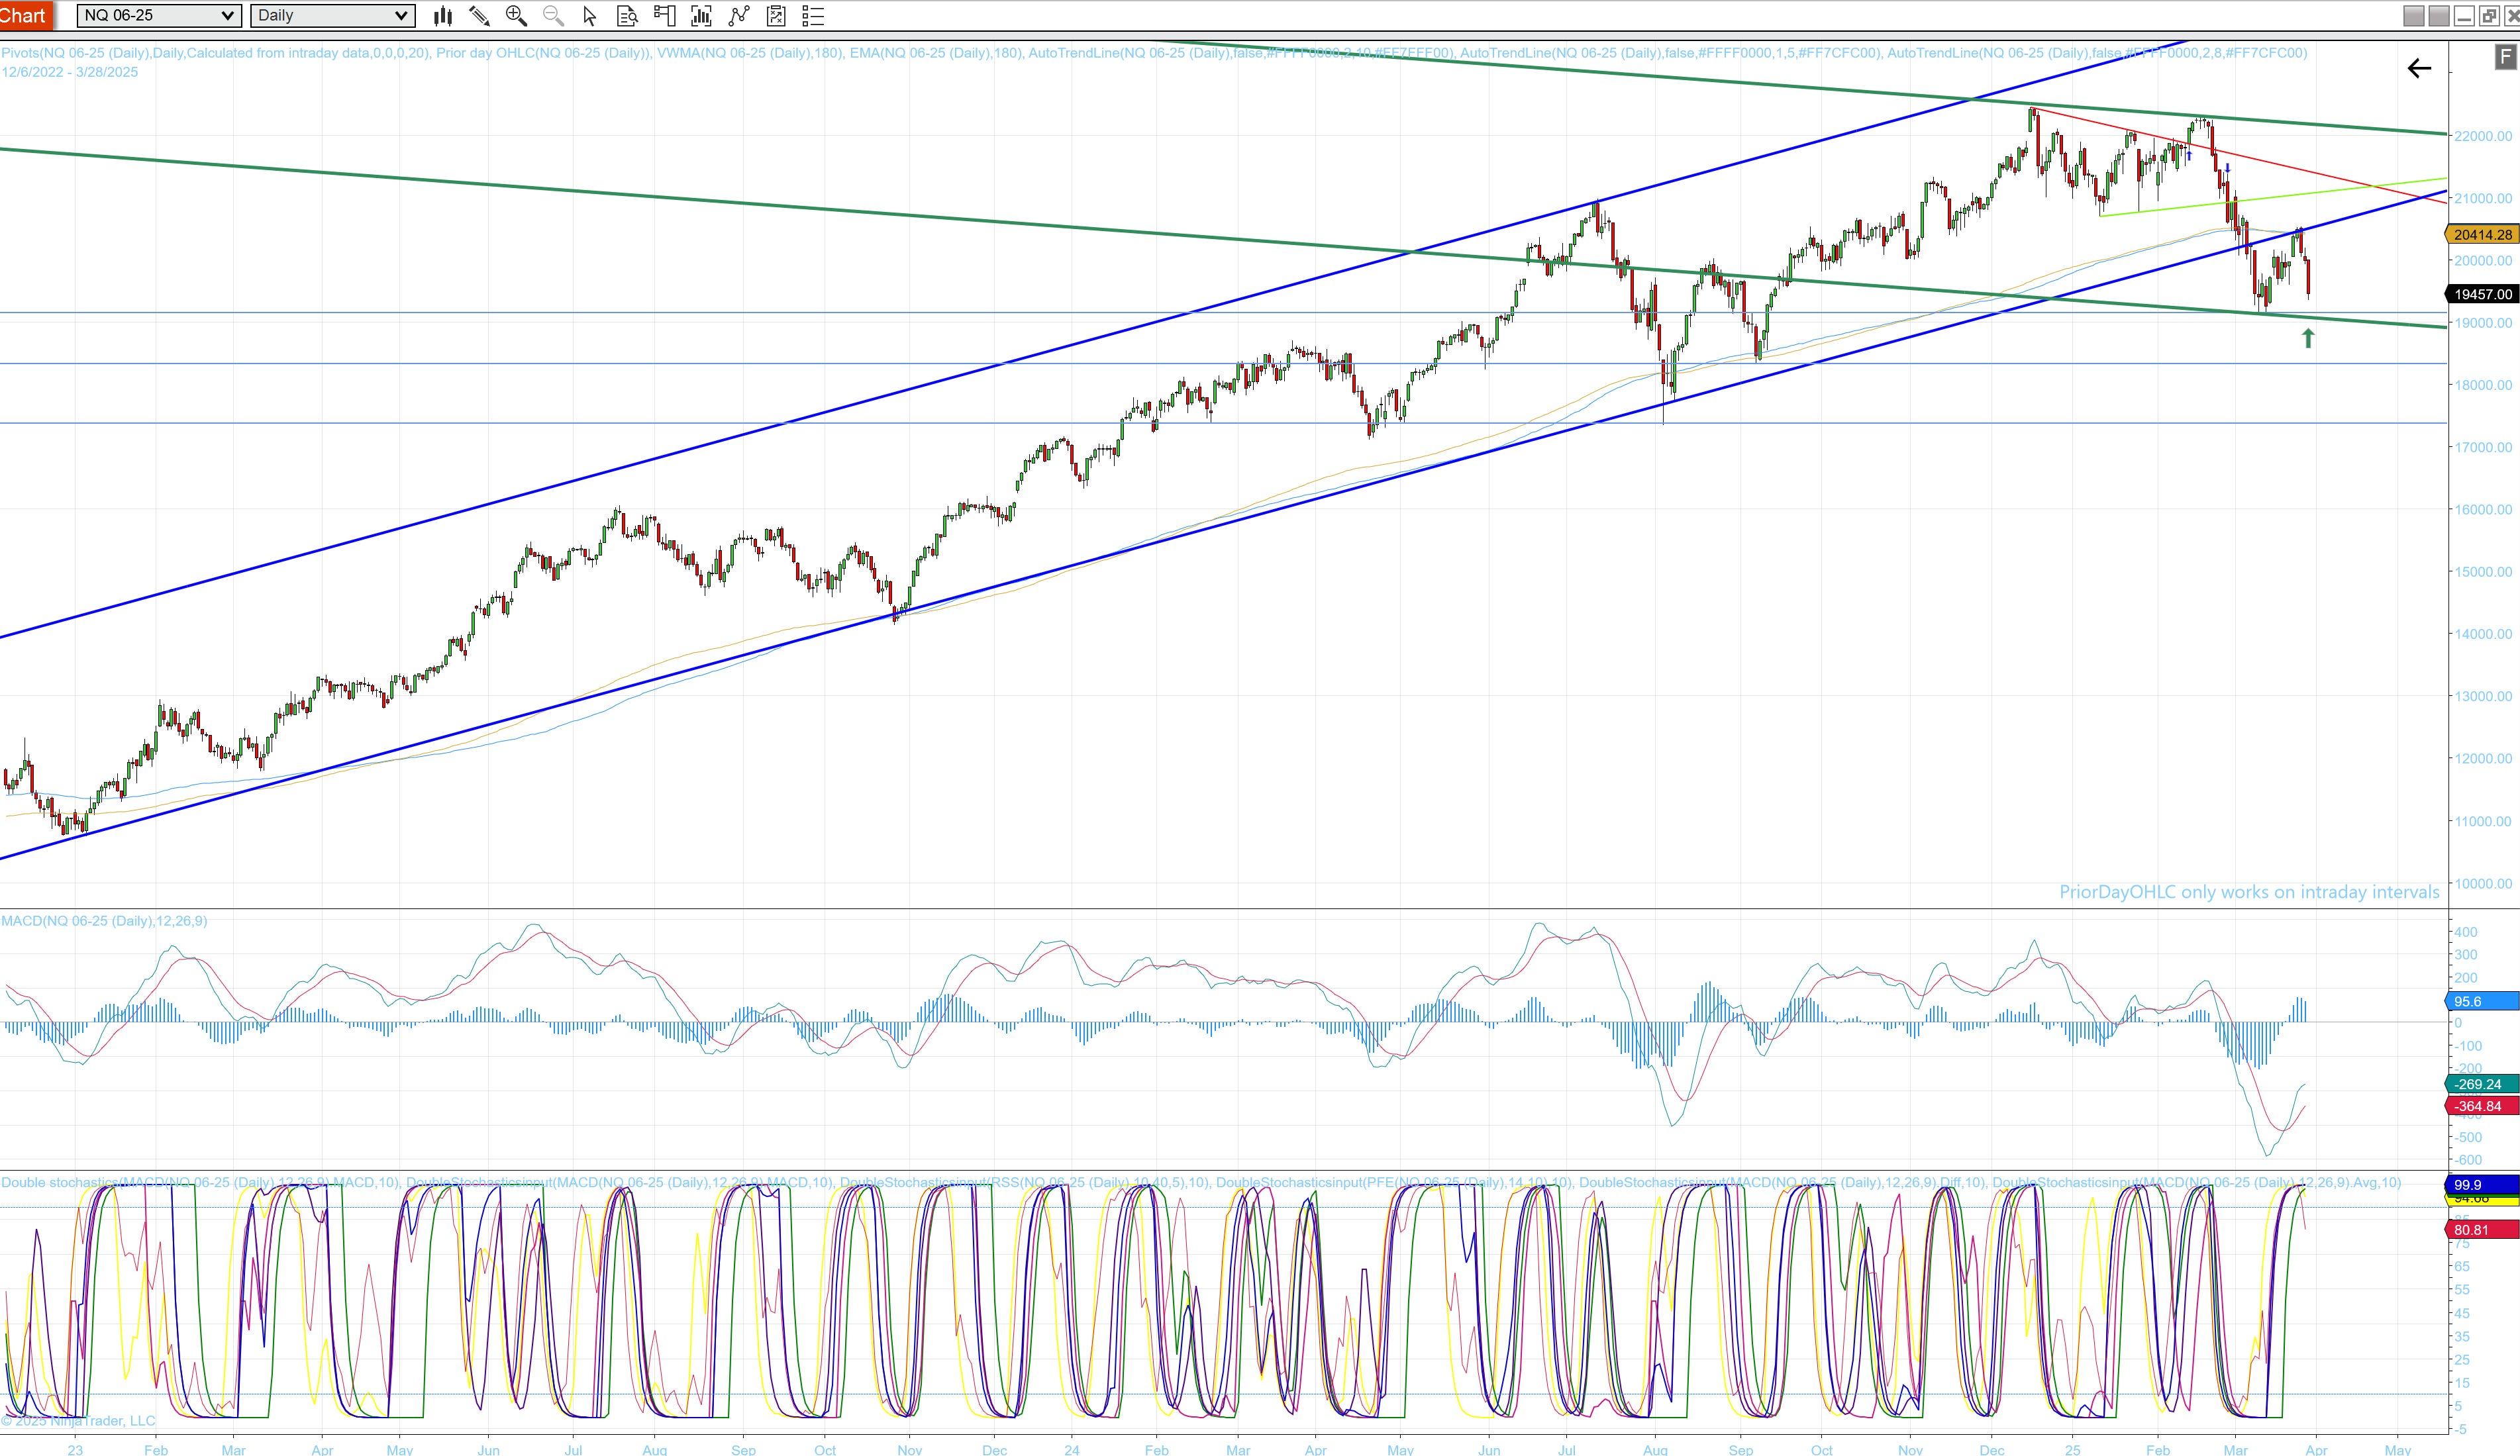
This technical breakdown doesn't necessarily signal doom, but rather a potential regime change that warrants closer attention to position sizing and sector exposure. After an extended uptrend of this sort, a period of consolidation or deeper correction would be historically consistent with healthy market behavior. Whether this breakdown marks the beginning of a more extended downtrend or merely sets the stage for a more complex bottoming process remains to be seen. What's clear is that the easy, channel-bound uptrend that defined the NQ for nearly two years now appears to be undergoing a significant test.
Why is this happening: tariffs, changes in political regimes, DOGE? I get all my news from comedians so what do I know, but one thing is certain—we’ve got major headwinds and tailwinds in focus.
Market Headwinds
Technical breakdown: As we just discussed with the NQ chart, the breach of a long-term uptrend channel suggests potential technical weakness ahead.
Valuation concerns: Many tech stocks and market indices are trading at historically high multiples, creating vulnerability to earnings disappointments.
Interest rate environment: While rates will eventually come down (fiscal policy leads monetary policy for once), current elevated rates create pressure on growth stocks and increase borrowing costs for companies and consumers.
Geopolitical tensions: Ongoing conflicts and trade tensions create uncertainty that markets typically don't appreciate.
Recession fears: Despite resilience so far, concerns about economic slowdown persist in some sectors.
Market Tailwinds
AI and technological innovation: Continued advancements in AI, automation, and other technologies drive productivity and new business opportunities to new heights. I don’t think the world is ready for the unprecedented productivity gains we’re about to see over the next 2 years.
Corporate profitability: Many companies continue to report solid earnings despite challenging conditions.
Consumer strength: Employment remains robust and consumer spending has shown resilience.
Potential monetary easing: Expectations for future rate cuts could provide support for risk assets.
Institutional positioning: Dry powder is still at record levels. Many funds still have cash to deploy, potentially providing support on significant pullbacks.
The interplay between these opposing forces will likely determine market direction in the near to medium term.
Where are we on the Q2 Forward Test after last week?
I know it’s only been one week, but I wanted to provide a quick update on the Q2 Forward Test (scroll to the bottom for a link to the portfolio). It is composed of 11 distinct automated trading strategies with 37 variations. Only 14 of those 37 variations were triggered last week.
I don’t normally like to make changes once the Forward Test has started, but I’ve created an agentic portfolio manager that provides recommendations/suggestions on changes to both composition and allocation so I’ll be implementing some of those changes this quarter.
For those of you just joining us, here’s a quick overview of the Q2 forward test composition which uses live data on simulated accounts:
Timeline: March 23, 2025, 6 PM EST through mid-June
Legacy performers: Three strategies carried over from Q1 (4c, 44b, 77c)
New blood: Eight strategies advanced based on stellar Q2 Incubator performance
Instrument Diversity:
NQ (Nasdaq futures): 22 strategies
ES (S&P 500 futures): 7 strategies
MNQ (Micro Nasdaq futures): 2 strategies
GC (Gold futures): 2 strategies
Specialized instruments: ZB (Treasury bonds), RTY (Russell 2000), CL (Crude oil), 6B (British Pound), YM (Dow Jones), and HG (Copper)
Timeframe Range: Multiple timeframes from 3 to 90 minutes
Recommended account size: $100K
Total net profit for the first week of the quarter was $28,802 on 115 trades.
Several strategies tanked and I’m going to pause them for now, but several did quite well, including one that made $81K and another that continues to have a 100% win rate trading CL. Here’s a chart with strategy performance (trade count, total profit, win rate, avg profit, avg loss) for the first week in the quarter: