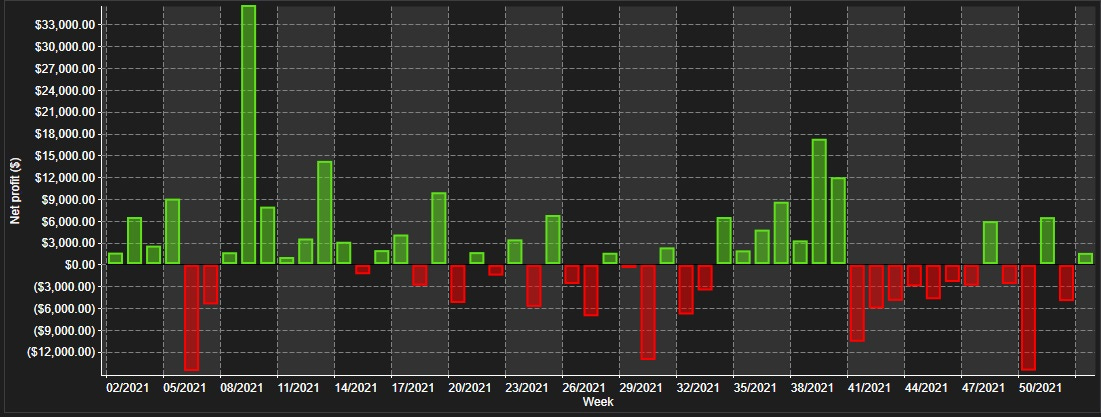
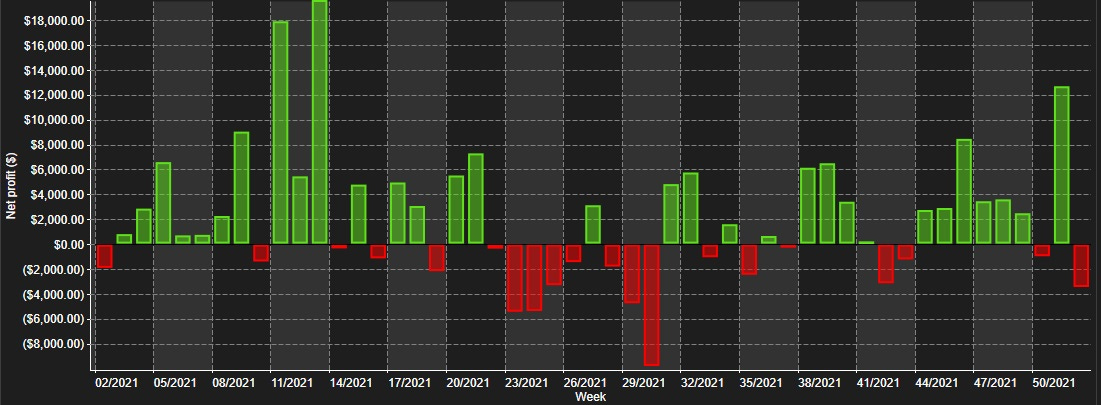
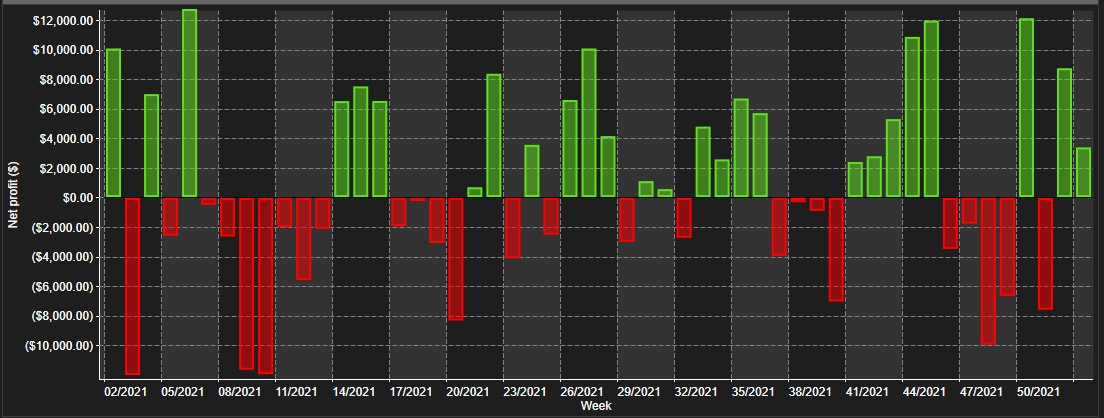
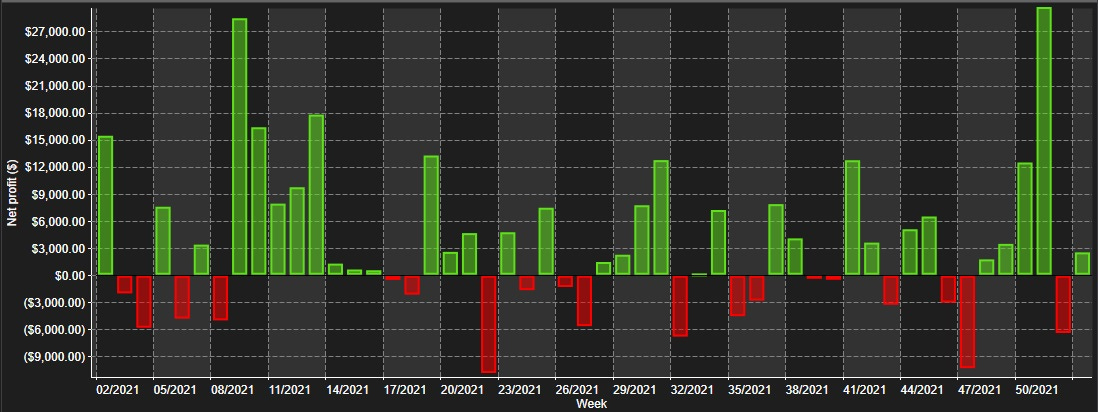
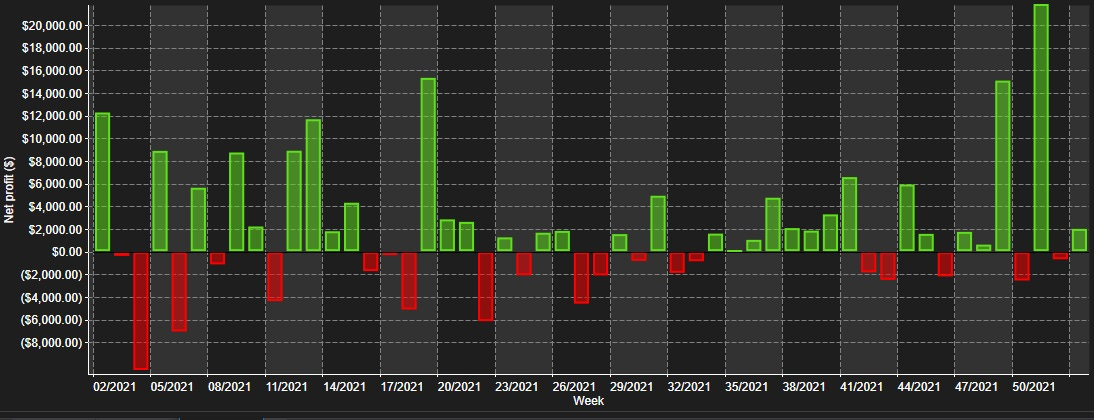
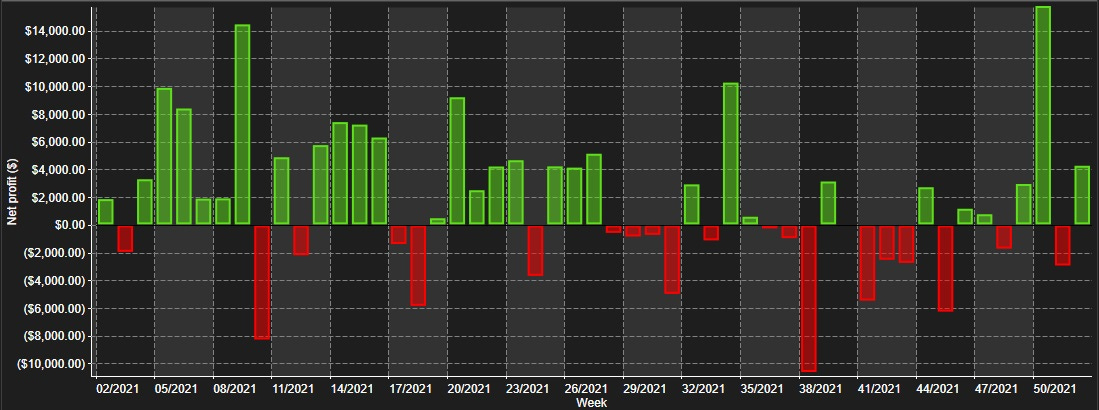
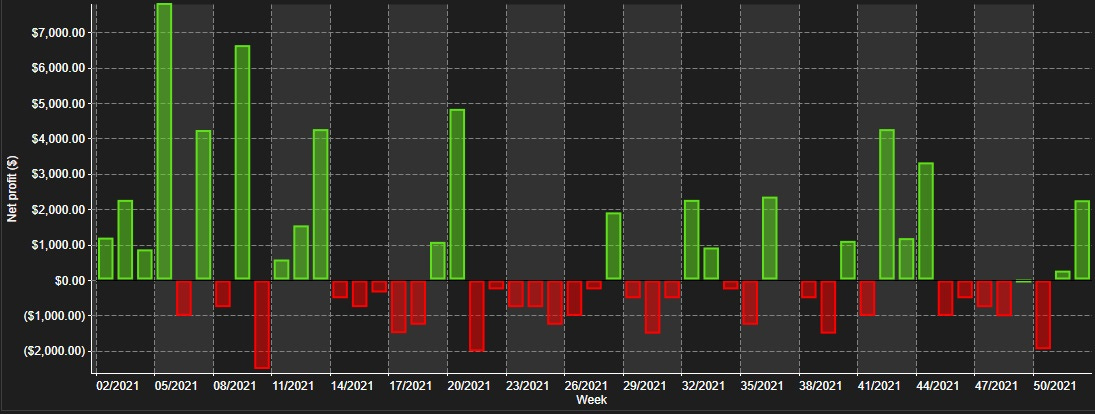
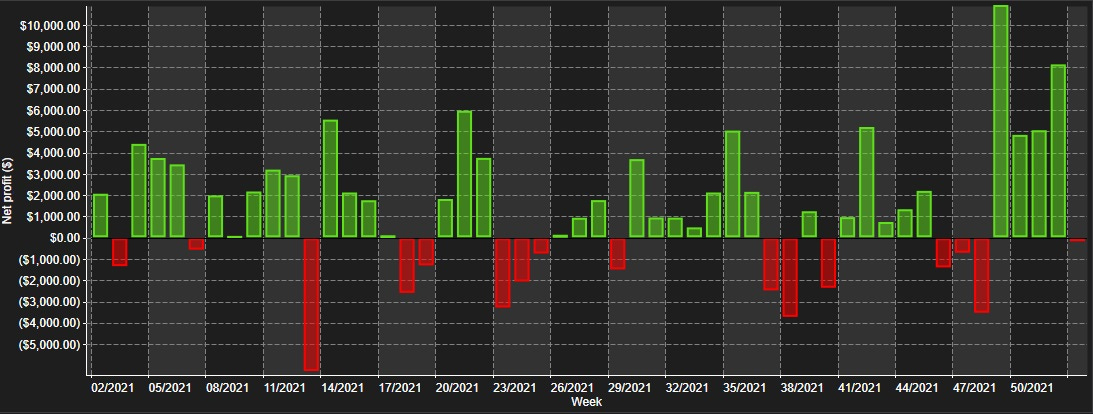
The following charts are meant to support the post: Mudder Report Analysis. They provide weekly net profit performance charts from 01/01/2021 to 01/01/2022 for all strategies referenced in the Mudder Report.
For links to all strategies click here.
Strategy 1 - 25 unprofitable week
Strategy 2 - 23 unprofitable weeks
Strategy 3 - 13 unprofitable weeks. Keep in mind that these are net profit charts. For example, the last week of November the gross profit was XYS and the gross loss was XYZ, so the total net profit was…
Strategy 4 - 17 unprofitable weeks
Strategy 5 - 26 unprofitable weeks
Strategy 6 - 21 unprofitable weeks
Strategy 7 - 20 unprofitable weeks
Strategy 8 - 25 unprofitable weeks
Strategy 9 - 19 unprofitable weeks
Strategy 10 - 13 unprofitable weeks (and all but 2 unprofitable weeks are worse than -$2K).
Strategy 11 - 23 unprofitable weeks
Strategy 12 - 21 unprofitable weeks
Strategy 13 - 23 unprofitable weeks
Strategy 14 - 20 unprofitable weeks
Strategy 15 -29 unprofitable weeks
Strategy 16 - 22 unprofitable weeks
Strategy 31 - 20 unprofitable weeks
Strategy 37 - 29 unprofitable weeks
Strategy 38 - 28 unprofitable weeks
Strategy 39 - 16 unprofitable weeks
Strategy 40 - 11 unprofitable weeks. Not only does Strategy 40 beat all other strategies in terms of number of profitable weeks, but there’s a discernible trend. Every first profitable week is followed by another. You can read more about this in the strategy 40 description.


