Automated Trading Strategy #95: Hunting For Market Regimes With Cluster Analysis
The Modern Trader's Safari Guide
Important: There is no guarantee that ATS strategies will have the same performance in the future. I use backtests and forward tests to compare historical strategy performance. Backtests are based on historical data, not real-time data so the results shared are hypothetical, not real. Forward tests are based on live data, however, they use a simulated account. Any success I have with live trading is untypical. Trading futures is extremely risky. You should only use risk capital to fund live futures accounts and if you do trade live, be prepared to lose your entire account. There are no guarantees that any performance you see here will continue in the future. I recommend using ATS strategies in simulated trading until you/we find the holy grail of trade strategy. This is strictly for learning purposes.
We’re on the hunt for the holy grail of automated trading strategy. If you have any questions, start with the FAQs and if you still have questions, feel free to reach out to me (Celan) directly at AutomatedTradingStrategies@protonmail.com.
I love the hunt, but it’s easy to get dismayed. The hardest part is creating conditions that work for all markets. One quarter a strategy will perform well and the next quarter, not so much. What this tells us is that market regimes exist, and they exist in many time frames: daily, weekly, monthly, weekly, quarterly, etc.
What exactly is a market regime?
A market regime is a distinct period or state in financial markets characterized by specific patterns of behavior, volatility, correlations between assets, and overall market dynamics. Market regimes come with their own unique rules and optimal strategies. These regimes can be identified by statistical properties and typically persist for meaningful periods before transitioning to different states.
Some common examples of market regimes include:
Bull markets (upward trending with low volatility)
Bear markets (downward trending)
Range-bound markets (sideways movement within boundaries)
High-volatility regimes (large price swings in either direction)
Low-volatility regimes (small, steady price movements)
It has become clear to me that unless we’re looking for trades that exist in very rare and extreme conditions, identifying the current market regime and adapting strategies accordingly is critical for consistent performance. Being able to identify the market regime is like being able to identify an oasis where patterns emerge, signals clarify, and profits flow.
What if I told you that instead of wandering aimlessly with our divining rods of technical indicators, we could be using ML techniques to map out these watering holes with scientific precision?
Welcome to Strategy 95, where we're trying to turn dowsing into a data science. In particular, I’m using a cluster analysis to develop a profile for those strategies that perform well in the best performing clusters. Here’s a screenshot of how Strategy 95 has performed so far this year. This is an optimization from 1 to 90 minutes.
And this is just the beginning. Strategy 96 builds on this concept by using market regime persistence as a logical argument for increased position size, but I’m getting ahead of myself. First, let’s discuss the analysis and development of Strategy 95.
Machine Learning: Cluster Analysis
Machine learning (ML) is a powerful branch of artificial intelligence (AI) that enables computers to identify patterns and make decisions based on data—without being explicitly programmed for every task. For traders, ML opens up a world of possibilities, from predicting price movements to dynamically adapting strategies.
Unlike traditional programming where you specify the exact rules, ML algorithms learn the rules directly from historical data. This is why I’ve been ramping up forward tests this year. By the end of the year I’ll have over 300 strategy variations running and I hope to use that historical data to learn even more about the market’s “rules”.
There are two main types of ML:
Supervised Learning: The algorithm is trained using labeled data (where the "right answer" is known). For example, predicting futures prices based on historical trends.
Unsupervised Learning: The algorithm is given data without labels and must find hidden structures or patterns. This is where clustering comes into play.
With the advent of ML, we can now uncover subtle patterns in market data that were previously hidden. Today, I'm going to focus on one such unsupervised technique: clustering.
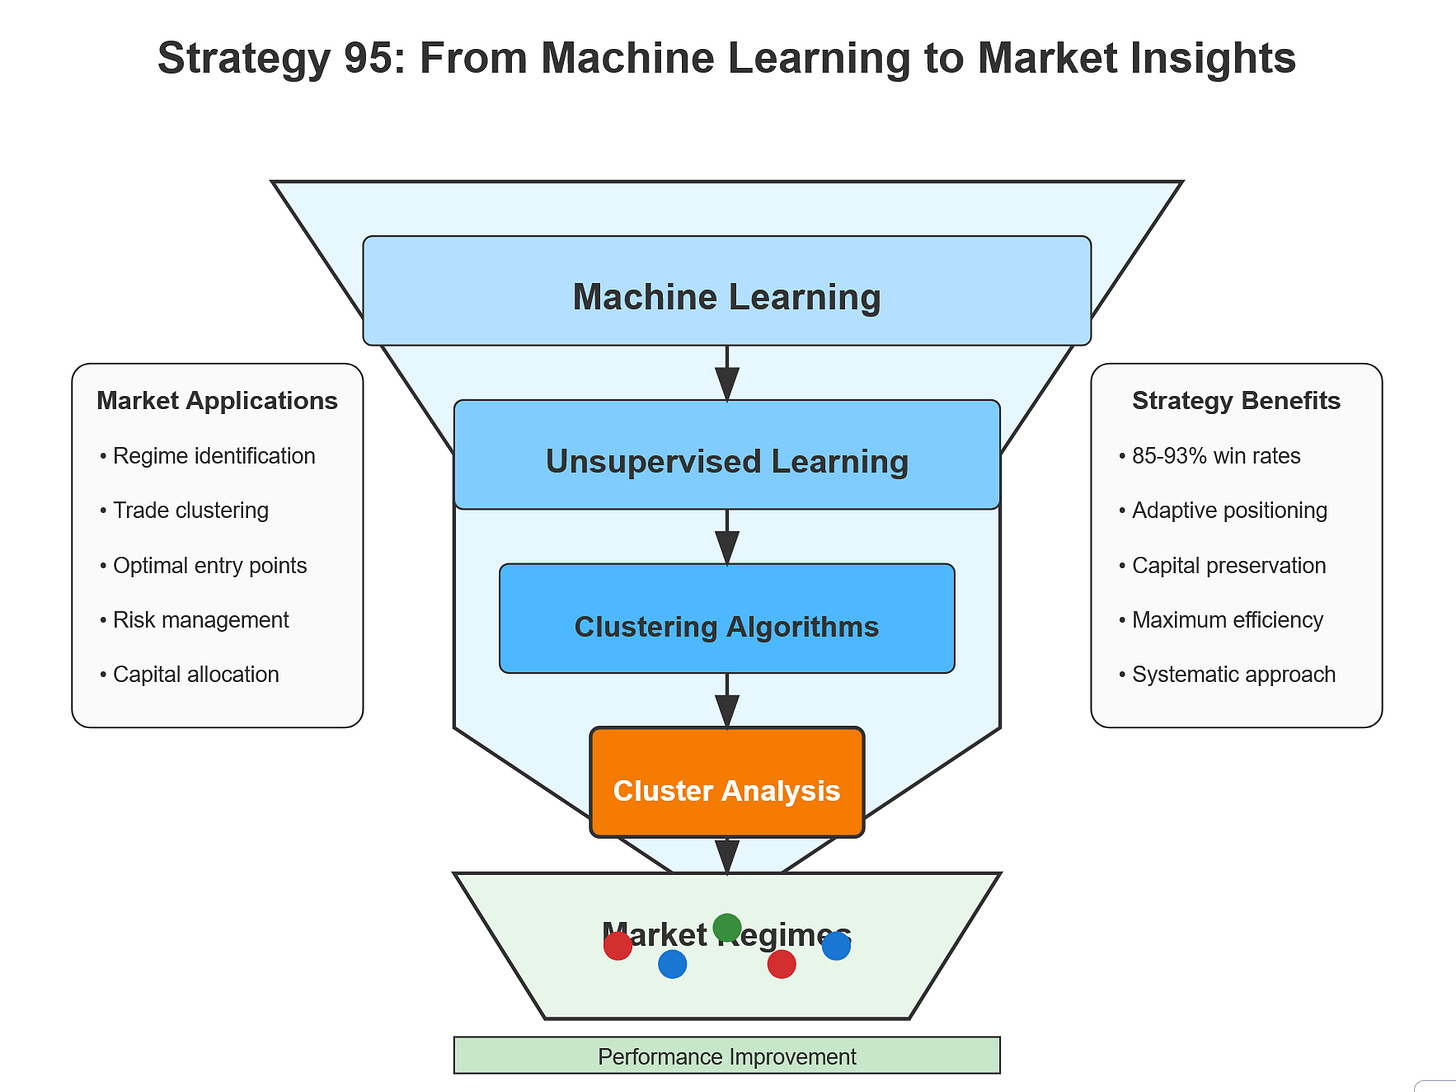
Clustering is a type of unsupervised ML that groups similar data points together based solely on their inherent characteristics. Think of it as modern-day dowsing: instead of using a divining rod to locate water, we use clustering to locate "water holes"—market regimes where the strategy is most profitable.
In Strategy 95, I use cluster analysis to segment trade data into groups that share similar traits (like profit efficiency, volatility, and risk/reward profiles). The idea is simple: if you can group trades into distinct clusters, you can then identify which clusters (or "water holes") represent favorable market conditions.
The Science and Art of Clustering
There are several clustering methods in ML, each with strengths and weaknesses for automated trading:


