

Automated Trading Strategy #93: Set Your Trading Strategies On FIRE
Strategy 3 made $115K over the last two months on one NQ contract; Strategy 93 is its bad ass successor.
Important: There is no guarantee that ATS strategies will have the same performance in the future. I use backtests and forward tests to compare historical strategy performance. Backtests are based on historical data, not real-time data so the results shared are hypothetical, not real. Forward tests are based on live data, however, they use a simulated account. Any success I have with live trading is untypical. Trading futures is extremely risky. You should only use risk capital to fund live futures accounts and if you do trade live, be prepared to lose your entire account. There are no guarantees that any performance you see here will continue in the future. I recommend using ATS strategies in simulated trading until you/we find the holy grail of trade strategy. This is strictly for learning purposes.
We’re on the hunt for the holy grail of automated trading strategy. If you have any questions, start with the FAQs and if you still have questions, feel free to reach out to me (Celan) directly at AutomatedTradingStrategies@protonmail.com.
The most important tool in our arsenal is the forward test. I’m currently running three forward tests and I’m in the process of building two more. A forward test is not a backtest; it uses live data on simulated accounts.
A few days ago I provided an update to the Q2 Forward Test. Today I want to update you on The Incubator. Only the best strategies in The Incubator will make it to the Q3 Forward Test.
The Incubator is currently running a grand total of 66 strategy variations on a continuous basis. Here’s an overview of performance so far by instrument.

The highest performing strategy is Strategy 3. These are the performance results for Strategy 3 over the last two months:

The strategy was started on 2/19 and has been running in the Incubator ever since. It has made 193 trades and has a net profit of $115K.
These are excellent results, so I created another version of Strategy 3 to take advantage of this edge. This new strategy increased position size on higher probability trades based on performance and is listed as Strategy93Scenario1 in the Q2 Forward Test. It is currently up $236,965 on 44 trades after only three weeks, but it could have just as easily ended down $236,965. This is because the strategy is highly volatile. There’s a defined edge, but it needs refining.
The strategy I’m going to share with you today is the latest version of Strategy 3. It has gone through a rigorous process to not only amplify profits based on highest probability trades, but trim losses on lowest probability trades. The result is a final Strategy 93, that is more profitable and less volatile. It available for download and described in detail below.
Before I share Strategy 93 with you, let’s talk about the process which can be applied to any strategy.

Since the dawn of human civilization, fire has been our greatest tool—transforming darkness into visibility, cold into warmth, and danger into safety. In the trading world, the market can often feel like a dark and perilous forest, filled with uncertainty and hidden threats. Just as early humans relied on fire for survival and advancement, traders need a transformative methodology. Enter FIRE: Filter, Isolate, Refine and Expand.
The FIRE Method isn't simply a standalone success story about Strategy 3—it's a process improvement strategy (think Six Sigma and LEAN for trading strategies) that’s been tested across the entire Incubator Portfolio. The results were conclusive:
Remarkable average return improvements—approximately 895%, with some strategies reaching as high as 6584% improvement.
Significant enhancements achieved by nearly half (48%) of all tested strategies, clearly demonstrating broad applicability.
Strategies with extensive forward-tested trade histories consistently benefited most, underscoring the importance of substantial forward test trade data.
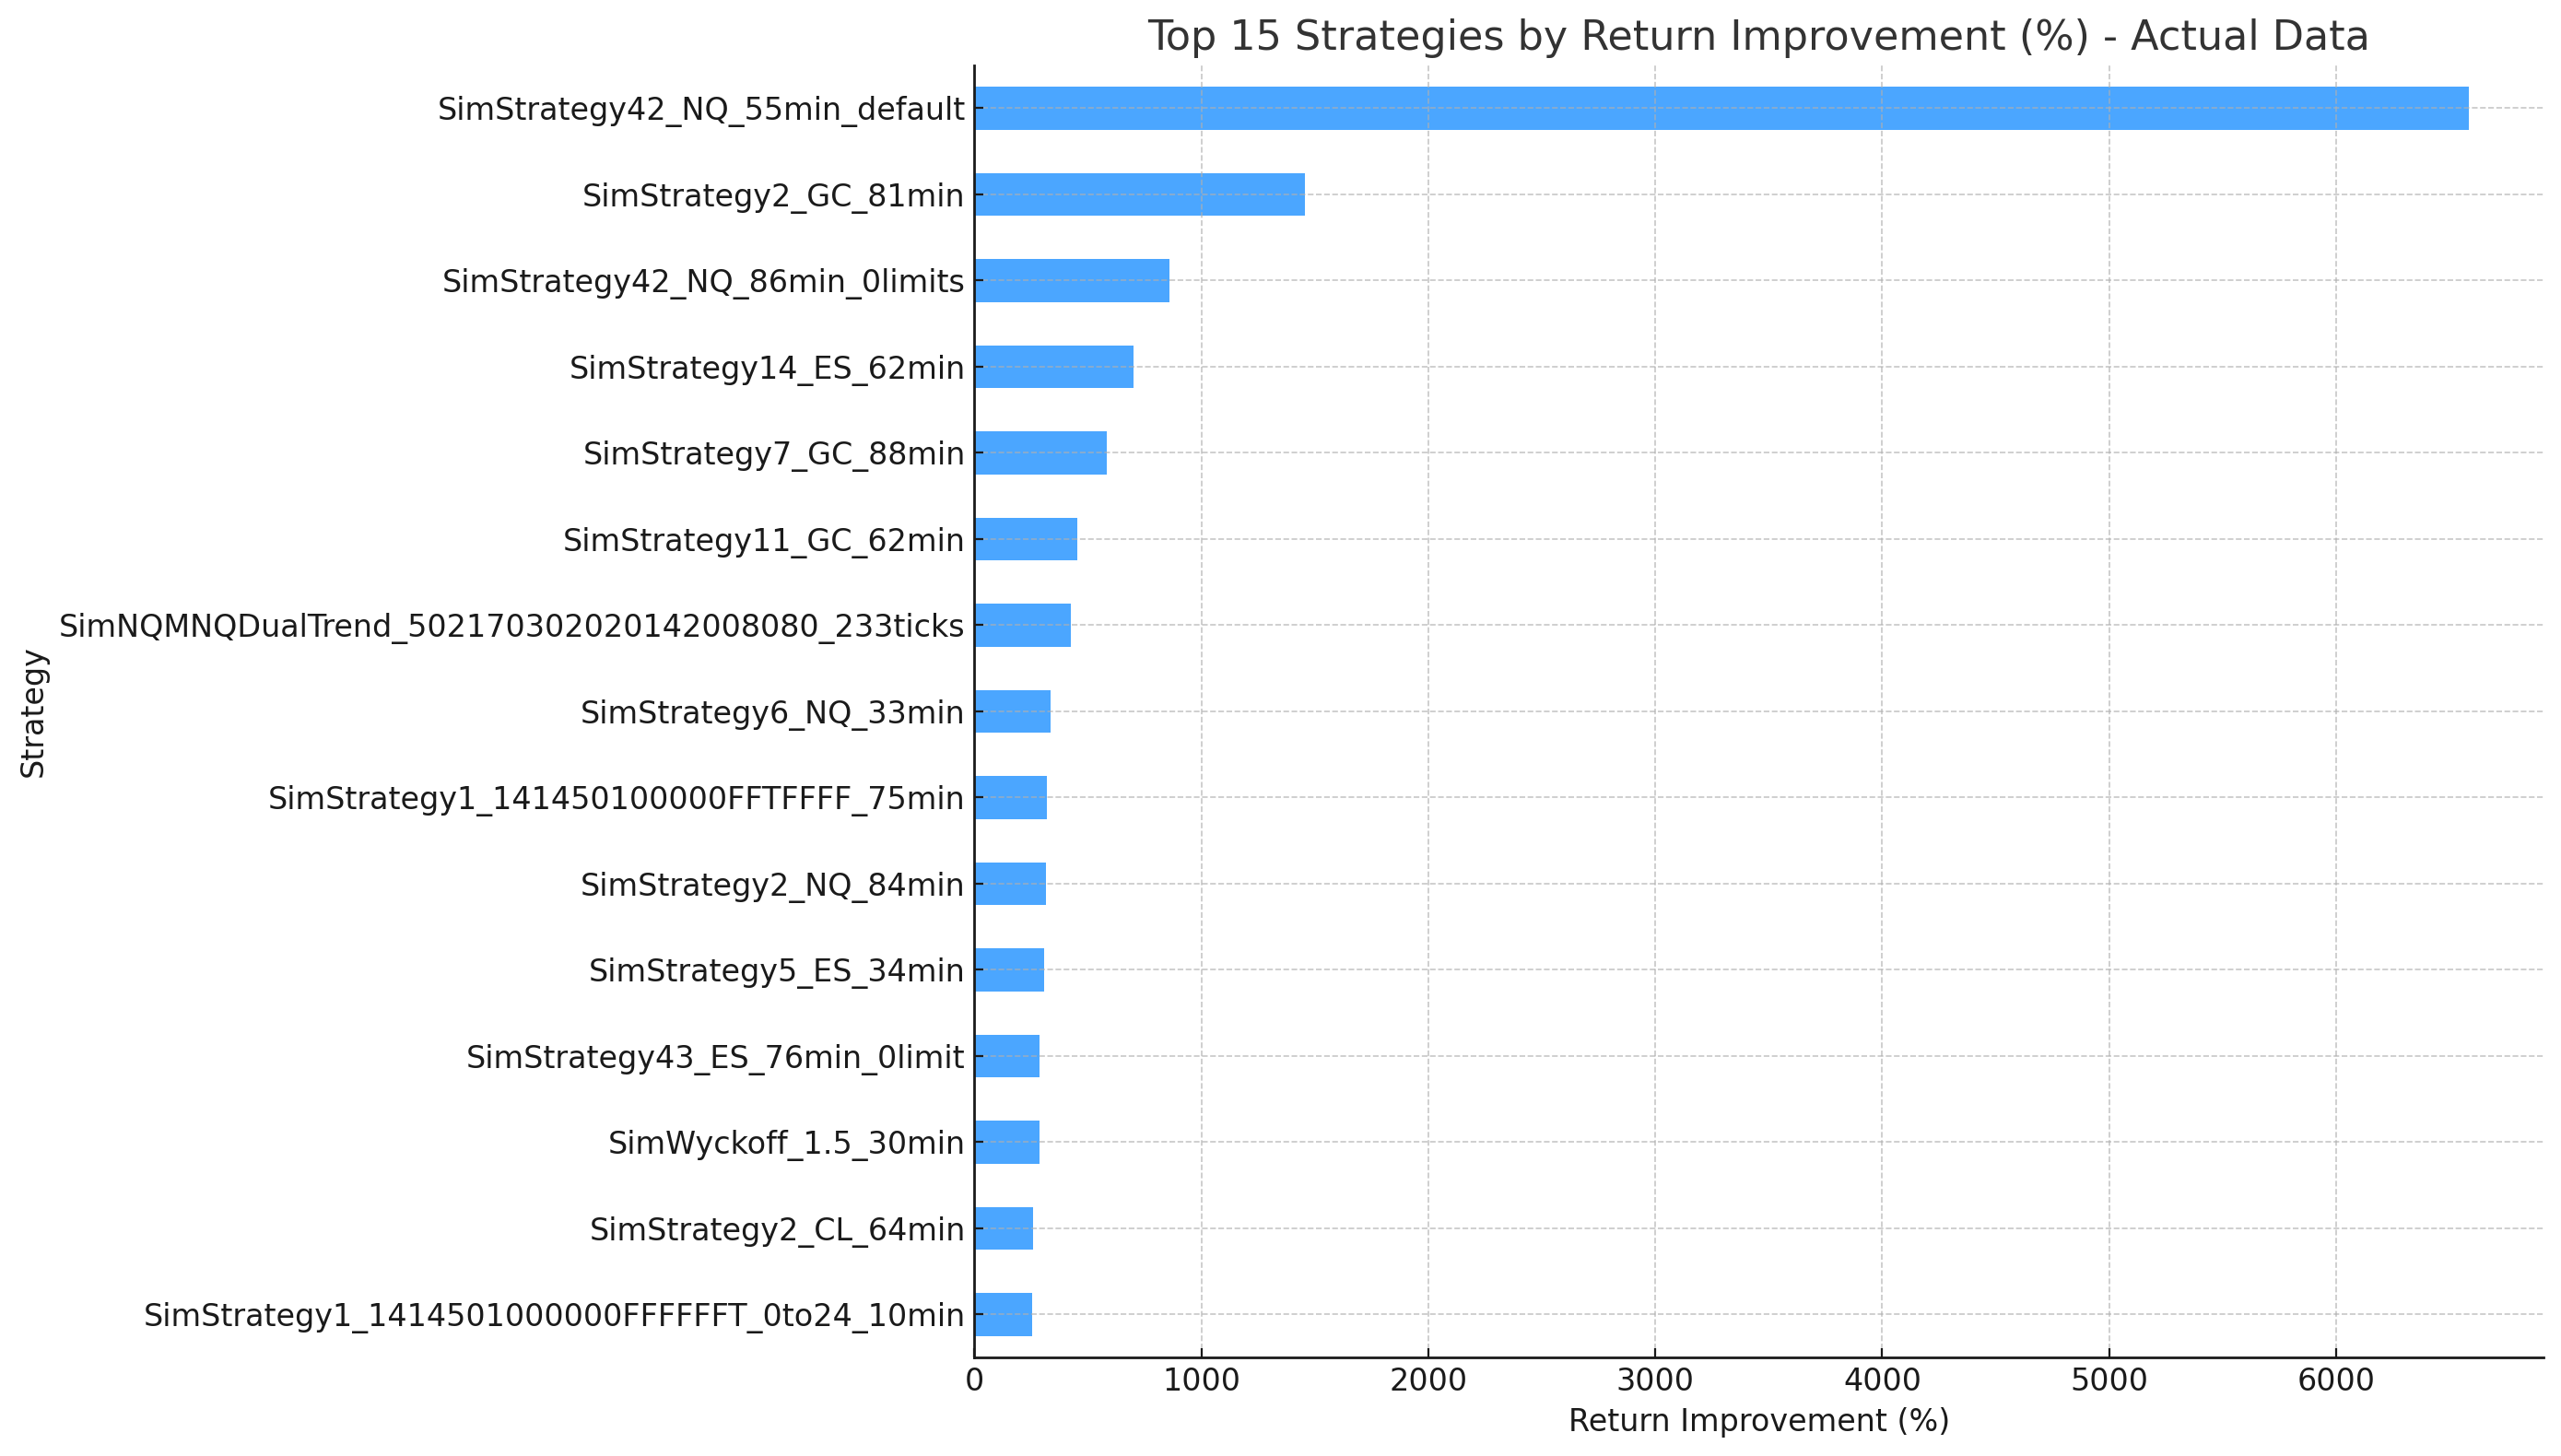
This chart clearly shows the dramatic improvements achieved by top-performing strategies in The Incubator:
SimStrategy42_NQ_55min_default leads with an astonishing 6584% improvement.
Seven strategies achieved over 400% improvement.
All fifteen top strategies showed more than 100% improvement.
The following chart compares the win rates before and after applying the FIRE process for the top 10 strategies.
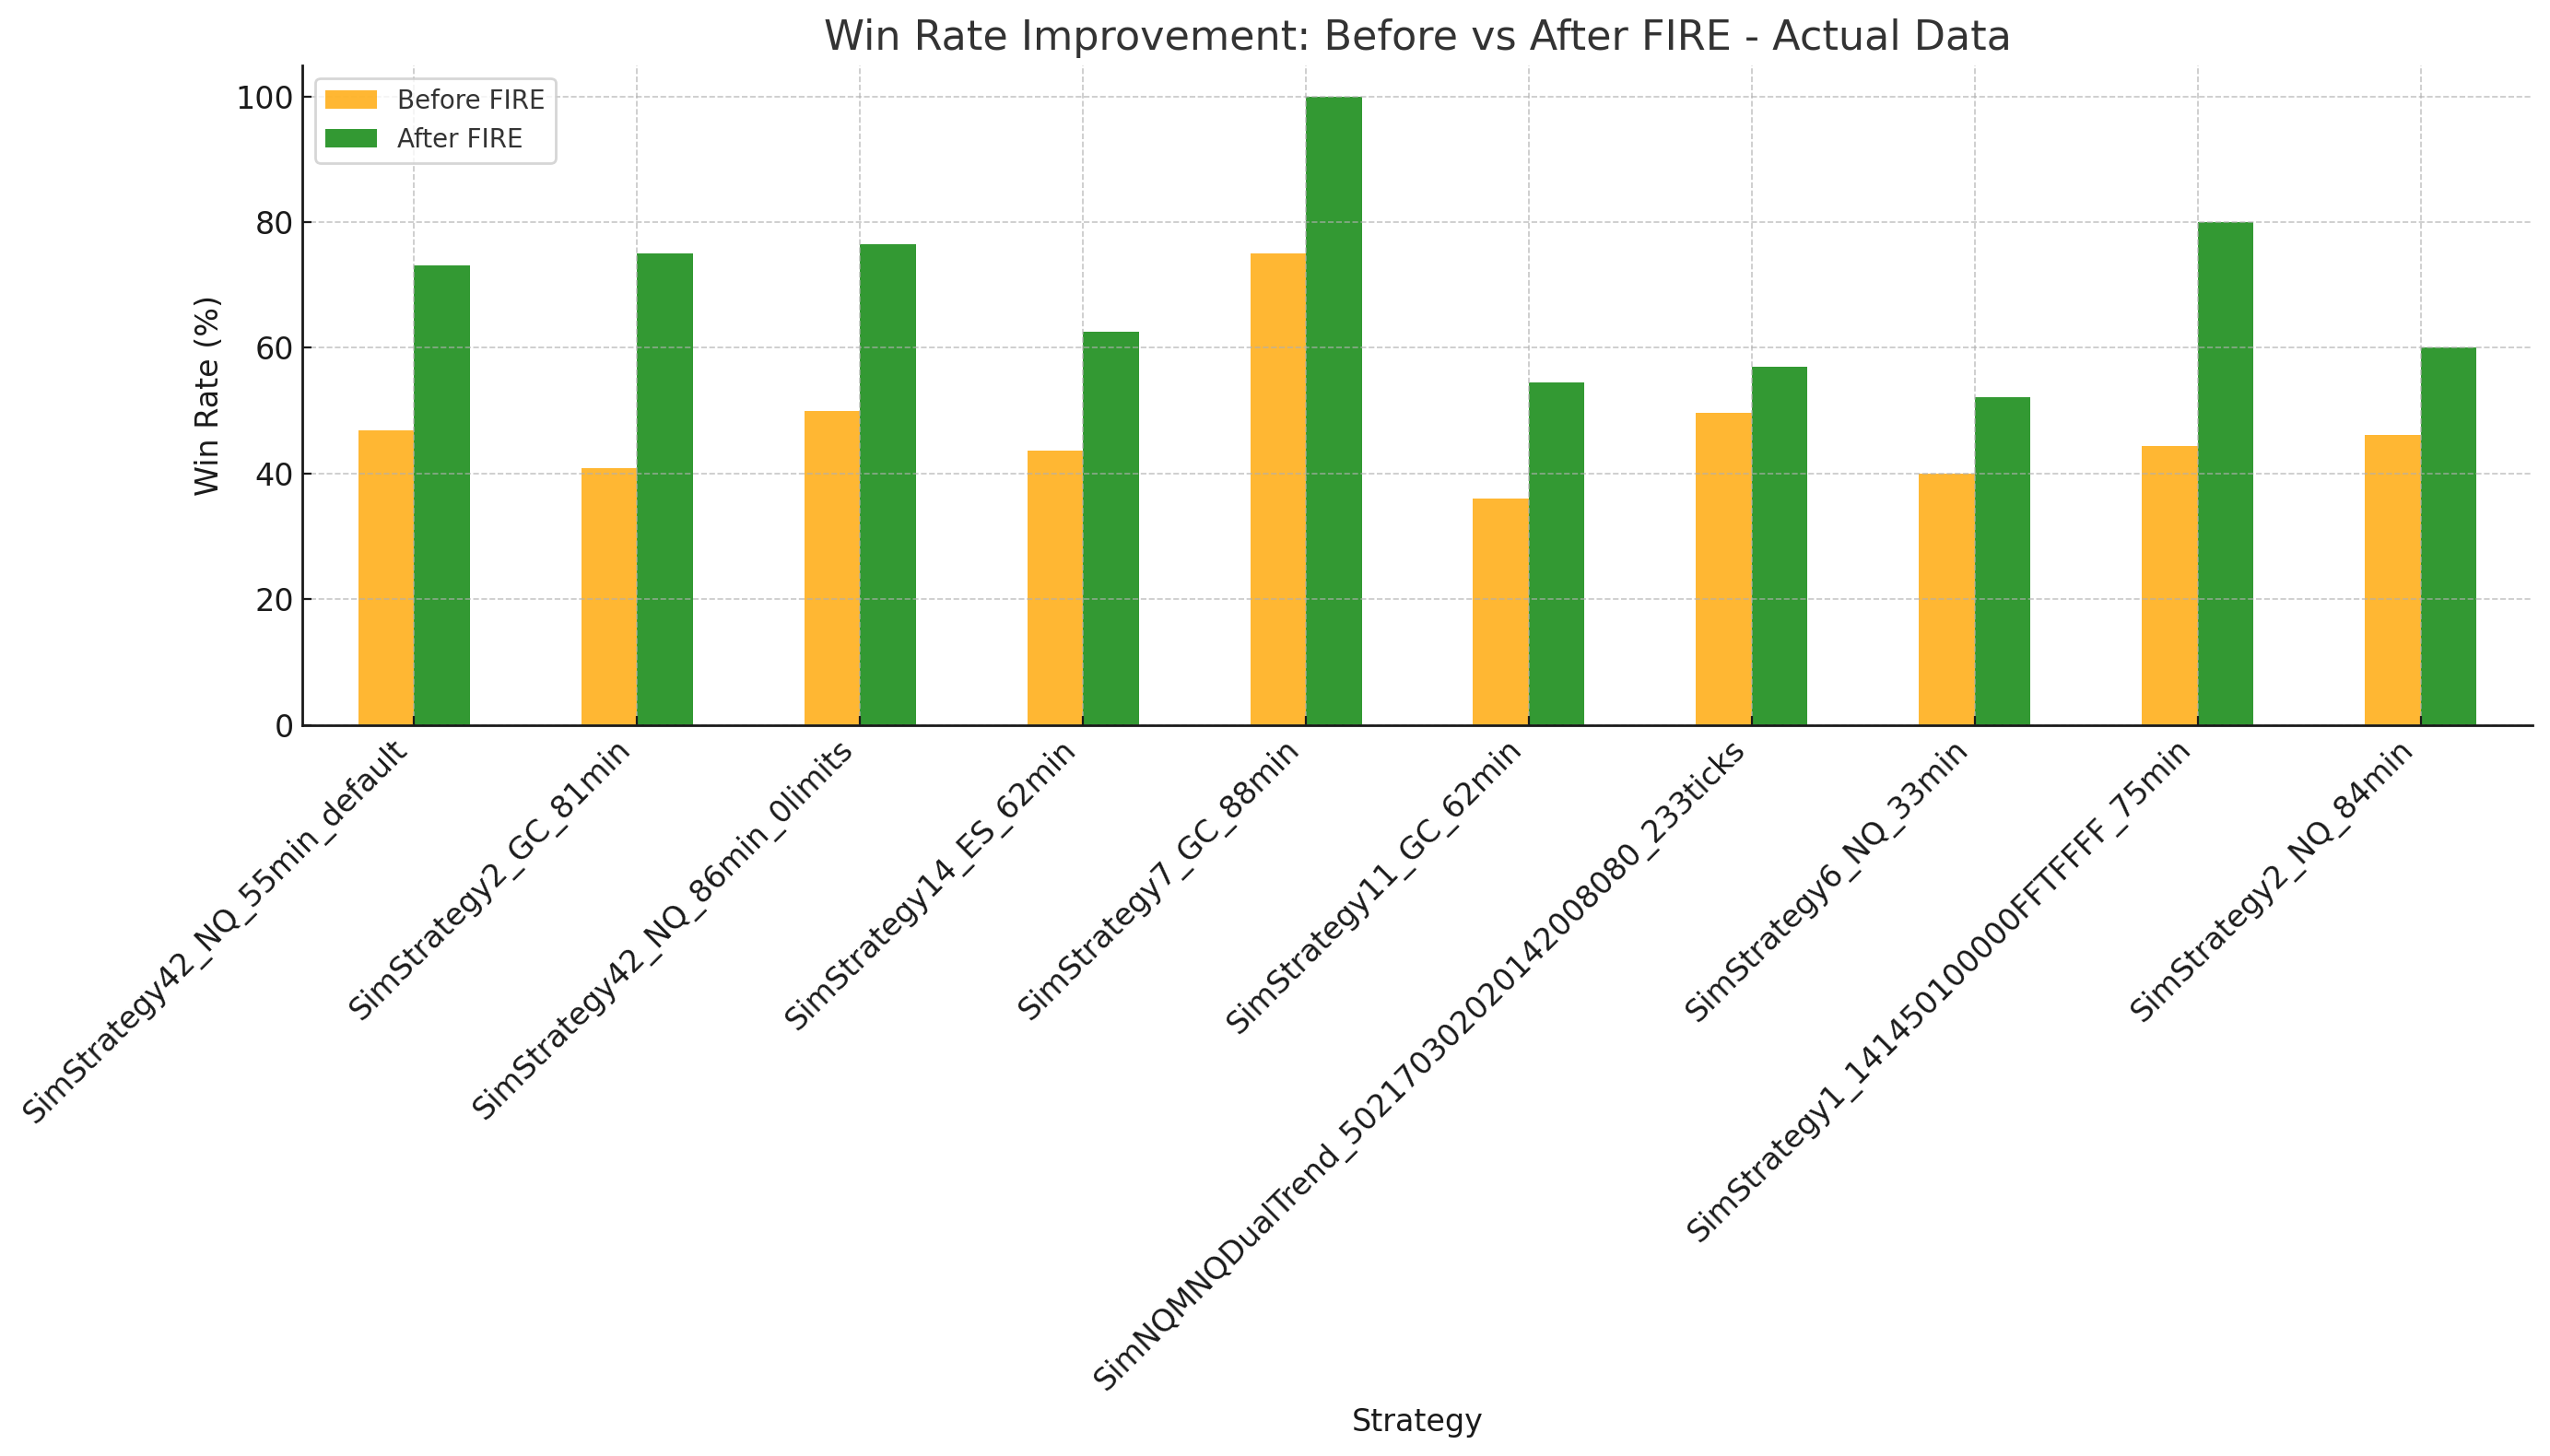
Key observations:
Almost all strategies showed significant win rate improvements.
SimStrategy7_GC_88min had the highest final win rate at 100% (up from 75%).
SimStrategy1_141450100000FFTFFFF_75min saw its win rate nearly double from 44.44% to 80%.
Even strategies with modest win rate increases often showed substantial return improvements.
The main takeaway here is that FIRE is an improvement process designed to distill and boost profits for any strategy. It’s not just about ‘Expanding’ or sizing up, like I did with the first version of Strategy 93. Yes, it made over $200K in a few weeks, but it was also highly erratic. This FIRE process is designed to help your strategies grow and preserve capital without the commensurate risk. It allows us to take advantage of volatile markets without having volatile cash flows.
Each step in this improvement ensemble provides another layer of improvement and support. Here’s an overview of the impact of each step on Strategy 3.

As you can see, the strategy starts off at $115K and a 1.84 profit factor, and ends with a combined $141K in net profit and a 4.09 profit factor. The Baseline is Strategy 3; the Combined FIRE is the new and improved Strategy 3 aka Strategy 93.
Here’s the impact of each step on net profit and profit factor:
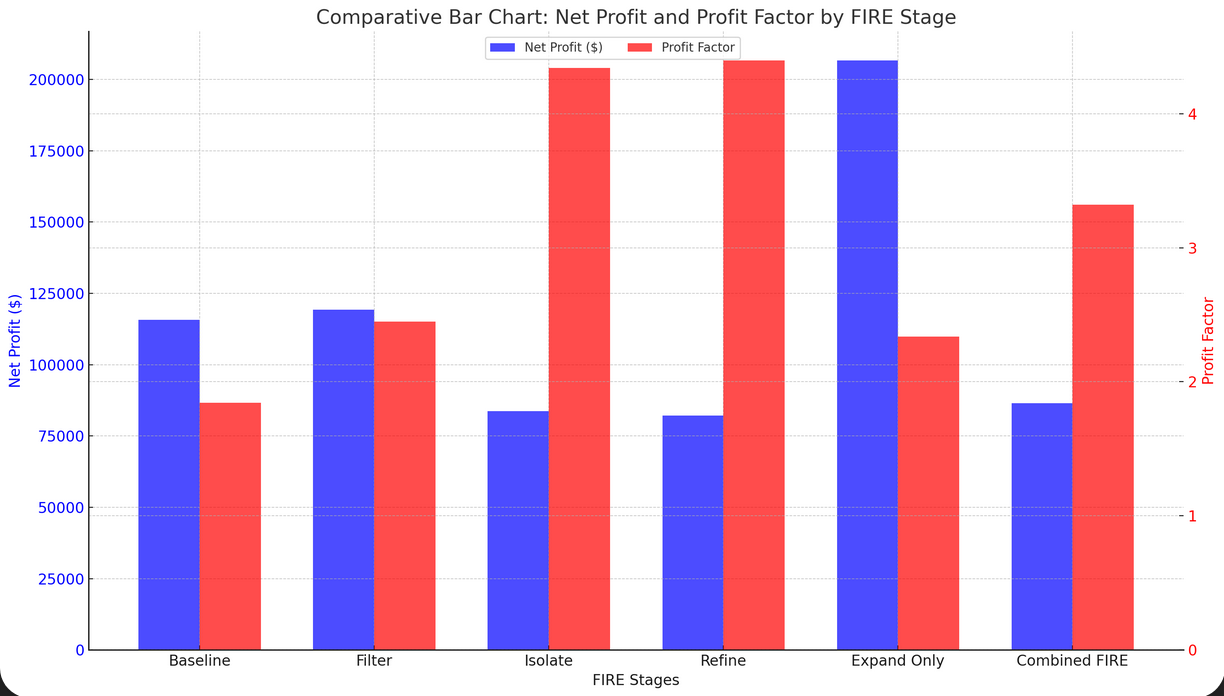
Notice how the Expand step has the most impact on overall net profit, but the Isolation step has the most impact on profit factor.
Now the obvious question is: why not just go with Isolate or Expand over Combined, which has a lower profit factor and net profit, respectively.
In a nutshell: I believe the Combined approach is more robust because it incorporates all methods. By robust, I mean consistent, smooth, reliable, lower drawdowns, etc.—it's the difference between a Hearts and Arrows Super Ideal and an Off Make.
Let’s take a look at the equity curve created after applying each step of the FIRE process to Strategy 3. The black dotted line is the Combined process.

While making fewer trades, the Combined approach is smoother and more consistent because it systematically reduces MAE and drawdown. These charts illustrate the impact of each step on drawdown and MAE.

Each FIRE stage has a complementary contribution to the risk-reward equation:
"Isolate" is strongest in risk-reward optimization
"Refine" excels at reducing MAE and drawdown duration
"Expand" is most effective at reducing maximum drawdown
Trade-offs exist between different objectives. Different stages of the FIRE strategy optimize for different aspects of trading performance, but the "Combined FIRE" approach provides balanced benefits across the board.
Now I’ll explain what the FIRE process is and we’ll use Strategy 3’s transformation into Strategy 93 as a working example.