Automated Trading Strategy #57
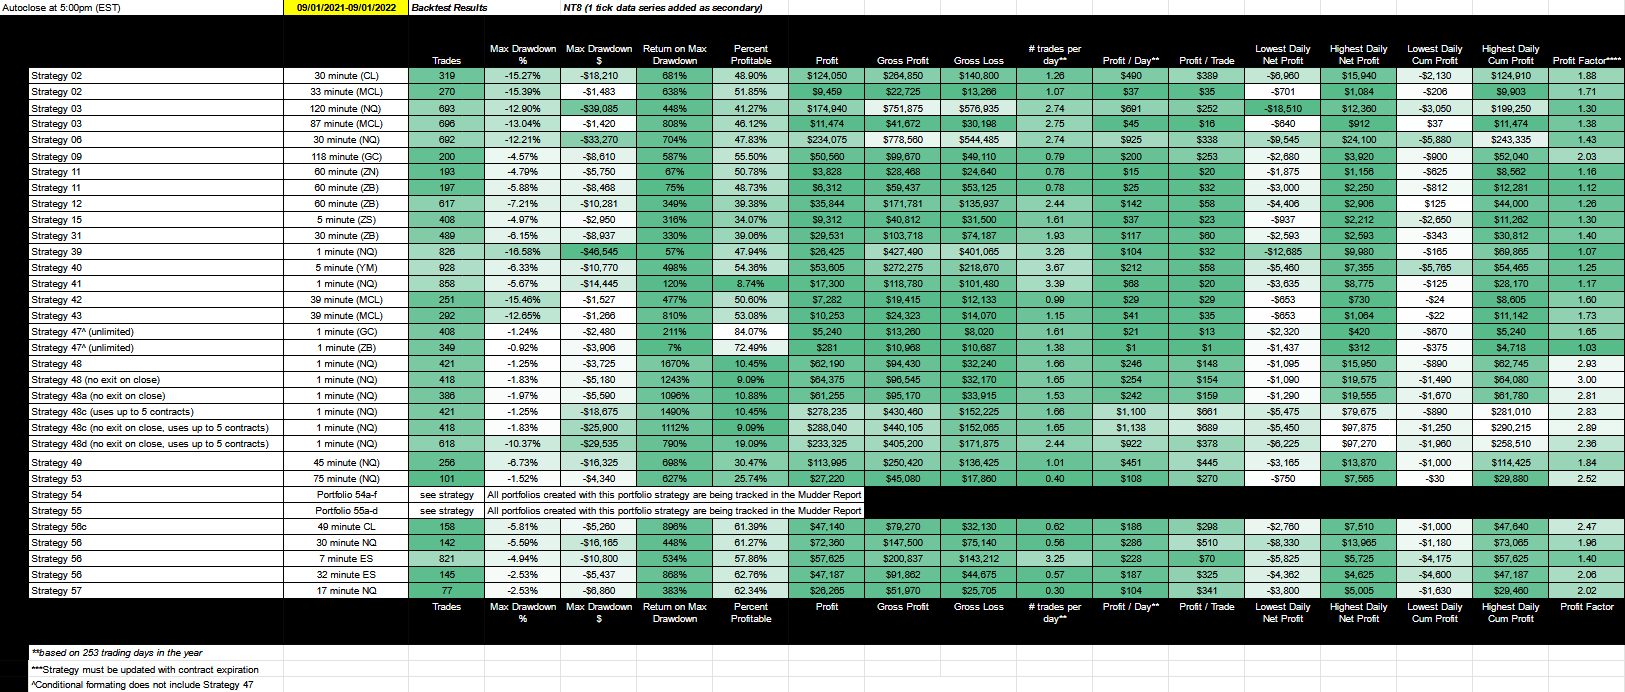
The Strategy 57 portfolio has a profit factor of 2.93 on 233 trades. It is profitable 64% of the time and has a Sortino ratio of 2.29.
There is no guarantee that these strategies will have the same performance in the future. Some may perform worse and some may perform better. We use backtests to compare historical strategy performance. Backtests are based on historical data, not live data. There are no guarantees that this performance will continue in the future. Trading futures is extremely risky. If you trade futures live, be prepared to lose your entire account. We recommend using our strategies in simulated trading until you/we find the holy grail of trade strategy.
Click on the table to enlarge.
As a quick reminder, our goal is to find the holy grail of automated trade strategy as defined below:
Profit factor greater than 3
Annual drawdown less than 3%
Annual return on max drawdown greater than 500%
Maximum daily net loss of -$1,000
Avg Daily profit greater than $1,000
Less than 5,000 trades annually
More than 253 trades annually
We haven’t found the holy grail yet, but we get closer with every strategy. For a link to all strategies and the most recent chart, click here.
A few months ago a subscriber asked me how we go about creating strategies. It’s a process, but I think our edge is that we focus on what works as traders.
For this strategy, we’re looking for the perfect trade opportunity. One that is rare and screams out at you because it gives results like this:
The first column is the instrument, the second column is the profit factor, the fourth column is the total net profit, and the eighth column is the max drawdown for each contract.
As you can see:
This strategy uses 6 futures contracts (CL, ES, GC, NQ, RTY, & YM) to net a profit of $82K for the year.
The combined portfolio has a profit factor of 2.93 profit factor and 233 trades. In other words, it made almost 3x more than it lost.
Strategy 57 is profitable 64% of the time and has a Sortino ratio of 2.29.
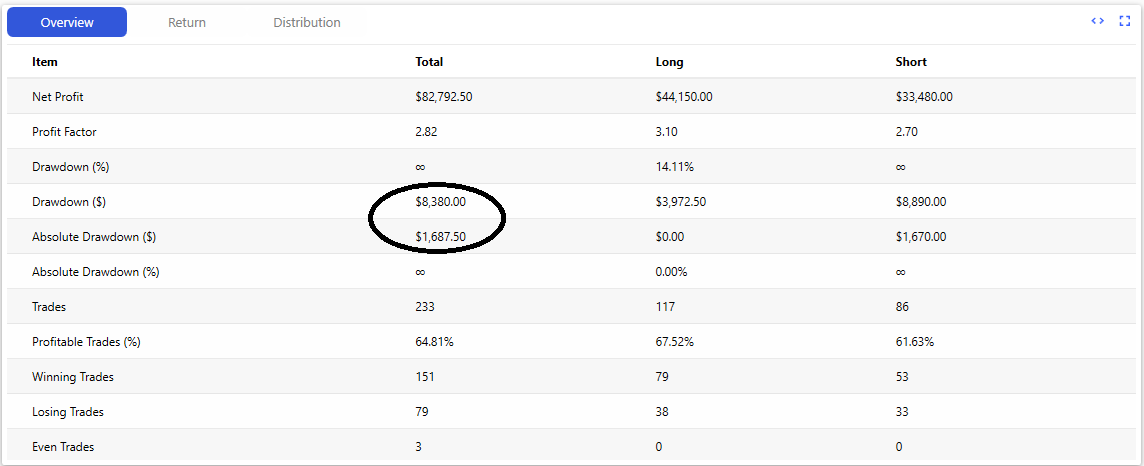
I also used a Portfolio Analyzer to understand the true nature of the drawdown. Ninjatrader’s Strategy Analyzer can tell us what the largest drawdown was for each strategy, but not each strategy when run concurrently as a portfolio.
As you can see from the chart below, the cumulative drawdown for this portfolio is actually $8,380, not $3,633. That‘s with all 6 contracts running at the same time. So the most the account balance falls from its high is $8,380. This suggests you want to have at least $10K in the account at all times. Additionally, the lowest the portfolio went below $0 profit is $1,687. So if this strategy was started on an account with a balance of $50K, the lowest the account balance would have gone is $48,313. Put yet another way, based on a one year backtest, this portfolio strategy made a net profit of $82K, and never lost more than $1,687 (absolute drawdown) for the entire year (11/1/2021 - 11/1/2022).
Now, let’s talk about what special situation Strategy 57 is capturing.


