Automated Trading Strategy #47
Strategy 47 only made $7,555 based on a one year backtest period, but it is profitable 97% of the time and has a profit factor of 108.
There is no guarantee that these strategies will have the same performance in the future. Some may perform worse and some better. Backtests are based on historical data, not live data. We use backtests to compare historical strategy performance and backtests can be inherently flawed due to limitations in historical data accuracy. We use backtests as a “first test” to further study and advise you do the same. Trading futures is extremely risky. If you trade futures live, be prepared to lose your entire account.
We recommend using our strategies in simulated trading until you/we find the holy grail of trade strategy.
For a link to all strategies and the most recent chart, click here.
Click on the table to enlarge.
What is volatility?
Volatility is fast price movement. Often referred to as the speed or velocity of price, volatility contains the same market structure, but at a faster rate. As I’ve said before, I believe 2022 is going to be one of the most volatile in recent market history so it makes sense to look for strategies that perform well in volatile markets. The conundrum is that volatility also tends to increase backtest risk. Translation: any model that improves with volatility is going to have a high backtest score. Strategies with a high backtest score may need additional help in live simulated trading. For example, adding a limit order or increasing the frequency on the data series.
As a quick aside, the backtest score is a score we give each strategy as an assessment of backtest risk. It is the last column in the performance chart above. Backtest risk is a function of slippage and slippage is any deviation from backtest results. As I’ve shown in the past, it is possible for slippage to be both positive or negative, but we’re primarily concerned with negative slippage from a risk perspective. Ideally, we want a backtest score of 0, but certain factors like volatility, net income per trade and the amount of time the trade stays in the market can increase the score. This is because time is an underlying variable of velocity. It is the way in which the movement (distance) is measured over the price change. As a result, any lag in time is going to delay the command to enter or exit the market and this can change results, especially in volatile markets. So, let this be an additional word of caution when running this strategy. That said, the profit factor for Strategy 47 is so high that there’s room for negative slippage.
From a trading perspective, volatility shows up in two ways: trends and chop. Volatility is great when it’s trending—it’s every traders dream to get in at the beginning of a fast moving trend—but it can also show up in the form of sideways action or market chop. So volatility that leads to a trend is good; volatility that leads to market chop is bad, but a good trader (and therefore a good strategy) should be able to take advantage of either.
At its heart, Strategy 47 is a scalping strategy that does particularly well in highly volatile markets — trending or chop, but especially chop.
Before we get into how Strategy 47 is formulated, let’s look at the performance results from Strategy 47:
It has a profit factor of 99 (if you calculate profit factor as gross profit/gross loss, it’s actually 108)
It has a total net profit of $7,555.
It is profitable 97% of the time
It made 87 trades from 4/15/2021 to 4/28/2022
The highest daily net profit is $560
The lowest daily net profit is -$65
Our main concern with Strategy 47 is the low trade count and low net profit, so we’re looking for additional ways to increase both. We’ve already found a way to increase net income to 48K and trade count to 444 with a few changes, and I’ll share that strategy with you on May 15 as Strategy 48. I actually like Strategy 48 better than Strategy 47 because it has a lower backtest score, but the profit factor is only 2.67.
Strategy 47 Performance Charts
This is the cumulative profit of Strategy 47 over a 1 year period (4/15/2021 to 4/28/2022). It never falls lower than $150.
This is how the strategy breaks down on a day-of-week basis. As you can see, it has an even performance throughout the week, but Fridays appear to perform slightly better.
This is the weekly profile of Strategy 47. You’ll notice that the strategy does not trade every week. You’ll also notice that the performance is increasing with volatility throughout the year. This is also confirmed in the cumulative net income chart above.
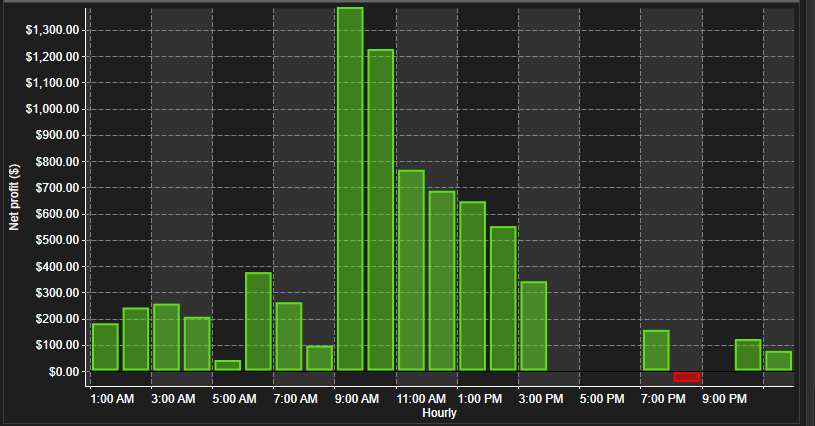
This is the hourly profile of Strategy 47. It shows that the strategy is more profitable during the more volatile hours of the day.
Here’s a chart showing average MAE over the life of the backtest. There are ~7 outliers.
As a word of caution, the highest max adverse excursion (MAE) is $5,145. It’s anomaly, but it exists nonetheless. This means that the daily drawdown can be large even though the max drawdown is only $65. In this way, even though it is an anomaly, the highest MAE can be used a proxy for starting account value rather than the max drawdown.
Now, let’s talk about how to recreate Strategy 47.


