Automated Trading Strategy #32
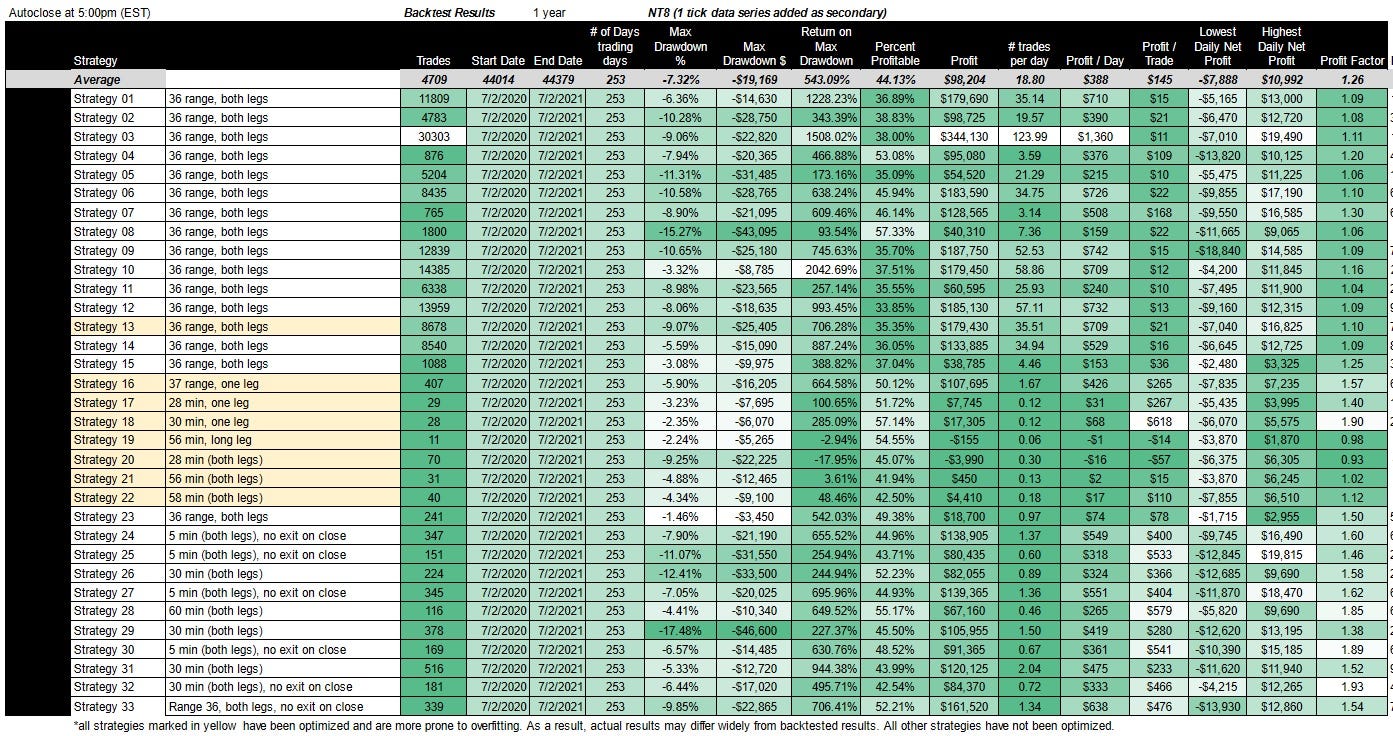
Strategy 32 made $84K in the last 12 months, makes $466 per trade and has a Profit Factor of 1.93.
There is no guarantee that these strategies will have the same performance in the future. Some may perform worse and some may perform better. We use backtests to compare historical strategy performance, but there are no guarantees that this performance will continue in the future. Trading futures is extremely risky. If you trade futures live, be prepared to lose your entire account. We recommend using our strategies in simulated trading until you/we find the holy grail of trade strategy.
For a link to all strategies and the most recent chart, click here.
Click on the table to enlarge.
*See below for Column Definitions
Strategy #32 Description:
Subscribers: Click here for the Subscriber-only version of this strategy description, which includes a full description of how to recreate this strategy.
Download Strategy #32 for NinjaTrader 8
Subscribers: Click here for the Subscriber-only version of this strategy description, which includes the NT8 download in C#.
Download Instructions
Ninjatrader download instructions are listed below.
Click on the link above to download the file.
Download the Strategy to your desktop, keep them in the compressed .zip file.
From the NinjaTrader Control Center window, select the menu Tools > Import > NinjaScript Add-On
Select the downloaded file from your desktop
If you've never used/run a strategy in NinjaTrader 8, NinjaTrader provides instructions here.
This is what the strategy looks like in chart form. It makes on average .72 trades per day, and has an average net profit of $333 per day or $466 per trade:
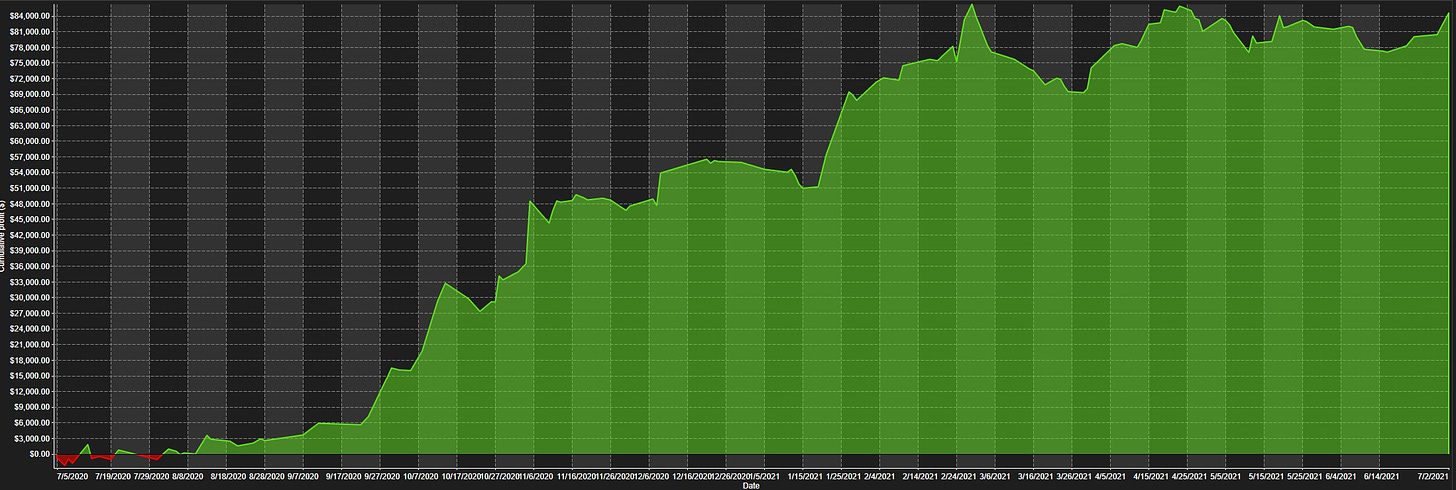
This is the cumulative profit of Strategy 32 over a 1 year period. It starts off shaky (reaching a cumulative low of -$2,160), but then continues to grow with a high degree of volatility.
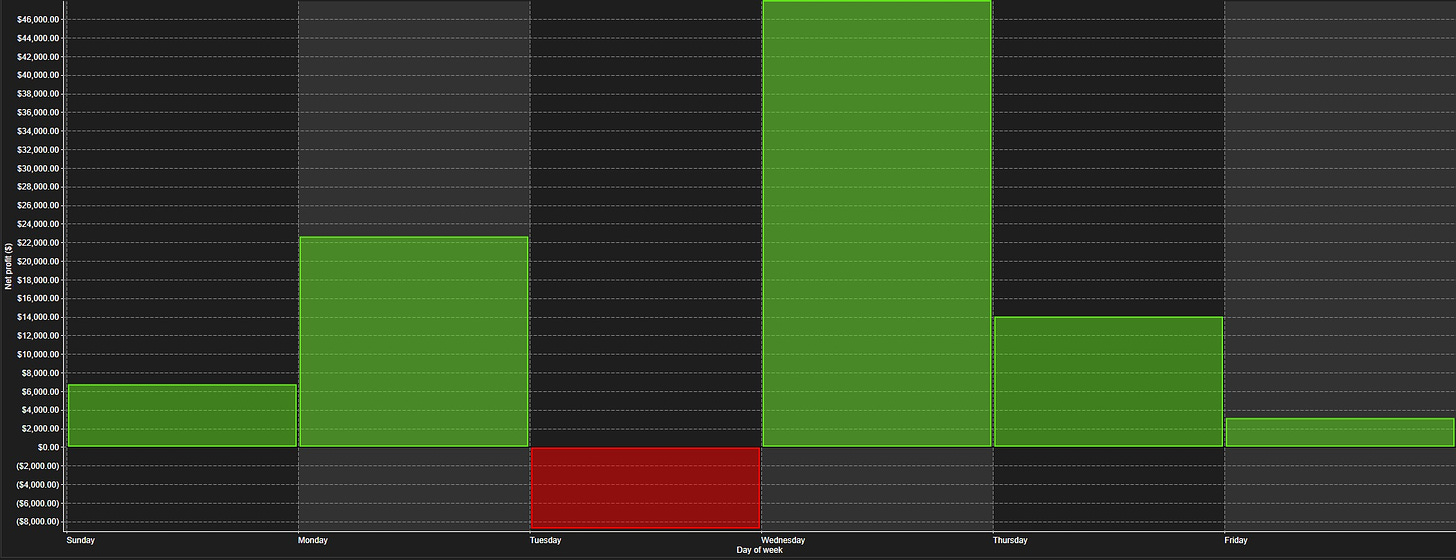
This is how the strategy breaks down on a day-of-week basis. This chart can help with determining the best time to get into a strategy. The average time of each trade in the market is 1.06 days, so you might want to start the strategy on Tuesday evening at 6pm (EST).
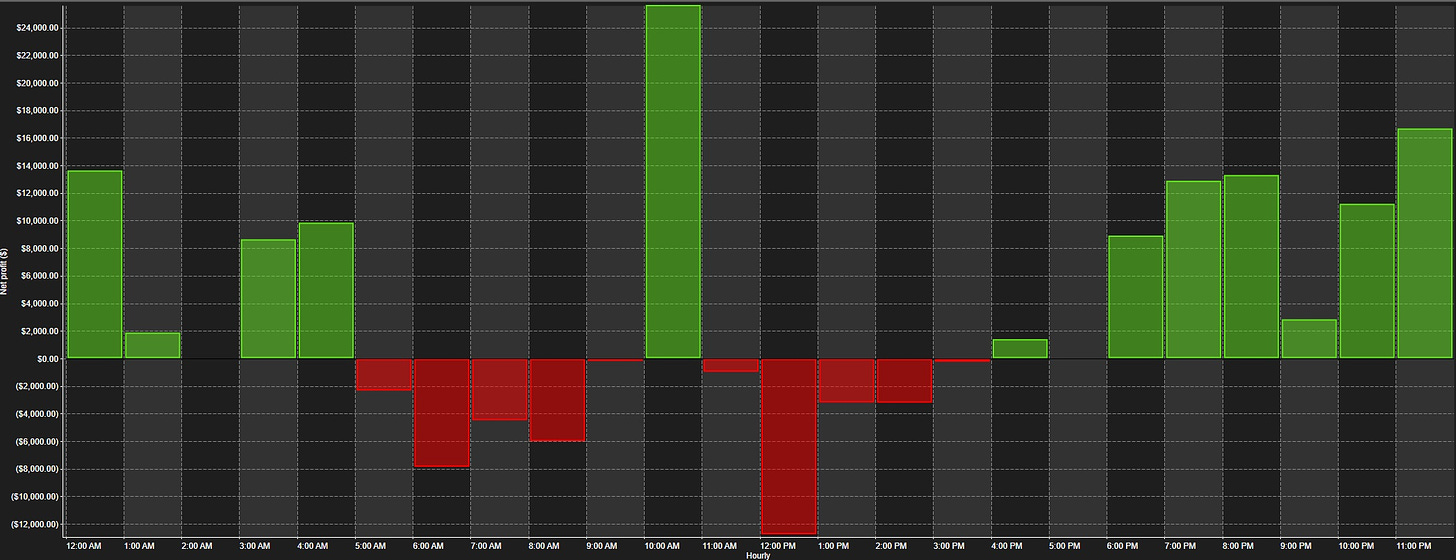
This is a chart of the strategy by hour of day. Keep in mind, this strategy does not close at the end of the day, but has a large number of trades in the 2am hour (EST).
We like this strategy because of its high profitability and low drawdown. It boasts one of the highest profit factors to date, but only makes 181 trades in the year so we’re skeptical of the results. We’re going to backtest this strategy over longer periods of time, but ultimately, we’re looking for a strategy that has high profitability, low drawdown and makes at least 500 trades per year. The hunt continues.
For links to all strategies click here.
*Column Definitions:
Strategy - The name of the strategy.
Trades - The number of trades used in the backtest to analyze performance. Our goal is ~1,000 trades for comparison.
Start date- The beginning date of the backtest.
End date - The ending date of the backtest.
# of days - The number of days in the strategy.
Drawdown - This refers to the maximum drawdown statistic, which provides you with information regarding the biggest decrease (drawdown) in account size experienced by the strategy. Drawdown is often used as an indicator of risk.
Drawdown = single largest Drawdown
As an example, your account rises from $25,000 to $50,000. It then subsequently drops to $40,000 but rises again to $60,000. The drawdown in this case would be $10,000 or -20%. Take note that drawdown does not necessarily have to correspond with a loss in your original account principal.
Return on Max Drawdown - We’ve added a dollar value for max drawdown along with a measure of return (return on max drawdown), which is calculated by dividing net profit by the max drawdown. In this way, max drawdown is considered the max capital investment. You can use the dollar value of max drawdown as a proxy for how much capital you need to trade the strategy. And, the higher the return on max drawdown, the better the strategy is in terms of risk/reward.
Percent Profitable - This is a metric that shows the number of winning trades divided by the number total trades.
Profit - The net profit made on the strategy for the backtest.
#trades per day - The average number of trades made per day using the strategy.
Profit / Day - The average profit made per day.
Profit / Trade - The average profit made per trade.
Lowest daily new profit - The worst performing day of the strategy in the backtest.
Highest daily net profit - The best performing day of the strategy in the backtest.
Profit Factor - Gross Profit divided by Gross Loss
Lowest daily cumulative new profit - The worst performing day on a cumulative basis.
Highest daily cumulative net profit - The best performing day on a cumulative basis.


