Automated Trading Strategy #44
Strategy 44 made $187K in 2021 based on backtests. Strategy 44b only made $57K, but its trades are profitable 95% of the time.
There is no guarantee that these strategies will have the same performance in the future. Some may perform worse and some may perform better. We use backtests to compare historical strategy performance. Backtests are based on historical data, not live data. There are no guarantees that this performance will continue in the future. Trading futures is extremely risky. If you trade futures live, be prepared to lose your entire account. We recommend using our strategies in simulated trading until you/we find the holy grail of trade strategy.
For a link to all strategies and the most recent chart, click here.
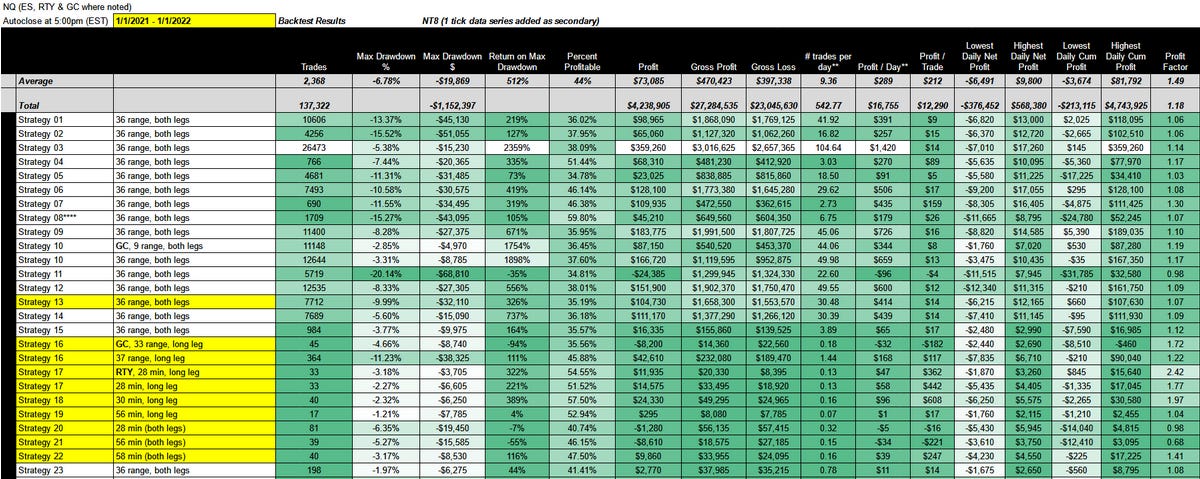
Click on the table to enlarge.
As a quick reminder, our goal is to find the holy grail of automated trade strategy as defined below:
Profit factor greater than 3
Annual drawdown less than 3%
Annual return on max drawdown greater than 500%
Maximum daily net loss of -$1,000
Avg Daily profit greater than $1,000
Less than 5,000 trades annually
More than 253 trades annually
We haven’t found the holy grail yet, but we get closer with every strategy. It’s also important to note that while we define the holy grail with the attributes above, your holy grail could be different. It’s a function of what you value most. For example, one of our subscribers told us that he was only interested in the average profit per trade. The strategy with the highest average profit per trade and the highest percentage of profitable trades used to be Strategy 41a(H) at 64%. Today, we’re introducing a strategy that is profitable 95% of the time (Strategy 44b), but it only makes $43/trade on average. This is still more than enough to cover commission and fees.
From the average profit per trade to the percent of profitable trades, we provide you with 16 distinct metrics to help you define and refine your own holy grail. Scroll to the bottom of this post or the performance chart for an explanation of each metric and let us know which metrics are most important to you.
Now let’s move on to Strategy 44…
Strategies 43, 43a, 44, 44a and 44b are all based on a command structure that is similar to Strategy 42. We’ve already posted the performance metrics for each strategy in the performance chart above so you can see how each strategy differs in performance. As a quick review:
The strength of Strategy 42 was in its high net income given its low number of trades. It made $161K from January 1, 2021 to January 1, 2022 and had a profit factor of 1.85 on 334 trades. What’s the downside? The downside was the drawdown at $19,270.
The strength of Strategy 43 is its high return on max drawdown at 1,186%. The higher the return on max drawdown, the better the strategy is in terms of risk/reward. We like to use return on max drawdown as a measure for a strategy’s ability to fund itself.
The strength of Strategy 43a is in its profit factor at 2.16.
Today we’re introducing Strategy 44 and 44b:
The strength of Strategy 44 is its net income at $187K and cumulative max drawdown at $16,865. It also has the highest profit factor at 2.28 on 297 trades giving it a profit per trade of $630.
The strength of Strategy 44b is in its drawdown at only 2.74% or $7,315. It does this because 95% of its trades are profitable. That means that of the 1,269 trades taken throughout the year, 1,205 of them were profitable. Unfortunately, this comes at a cost to net income, which drops from $187K to $54K, but it’s a question of what you value. It may be that your values change based on your cumulative net profit. For example, perhaps you value a higher net profit over a higher percentage of profitable trades once you’ve made 3x your drawdown. Once you hit your target, you can afford the higher drawdown that comes with a higher net profit.
Each strategy/variation has its strengths and weaknesses. It’s also important to note that all strategies end before session close, so you don’t have to worry about initial margin. In other words, the strategies require less capital to trade. To learn more about the impact of initial margin, click here.
Now let’s move to strategy performance.
Strategy 44 Performance Charts
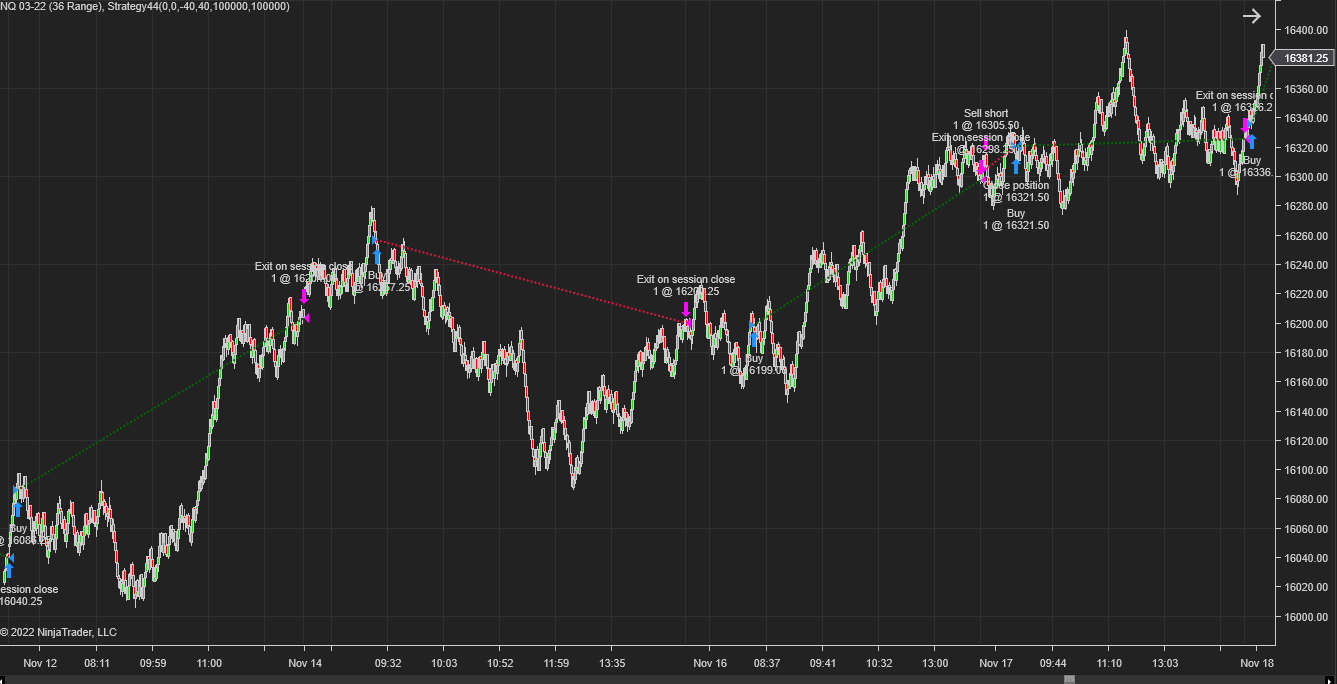
This is what Strategy 44 looks like in chart form. It makes on average 1.17 trades per day, and has an average net profit of $740 per day or $630 per trade on one NQ contract.
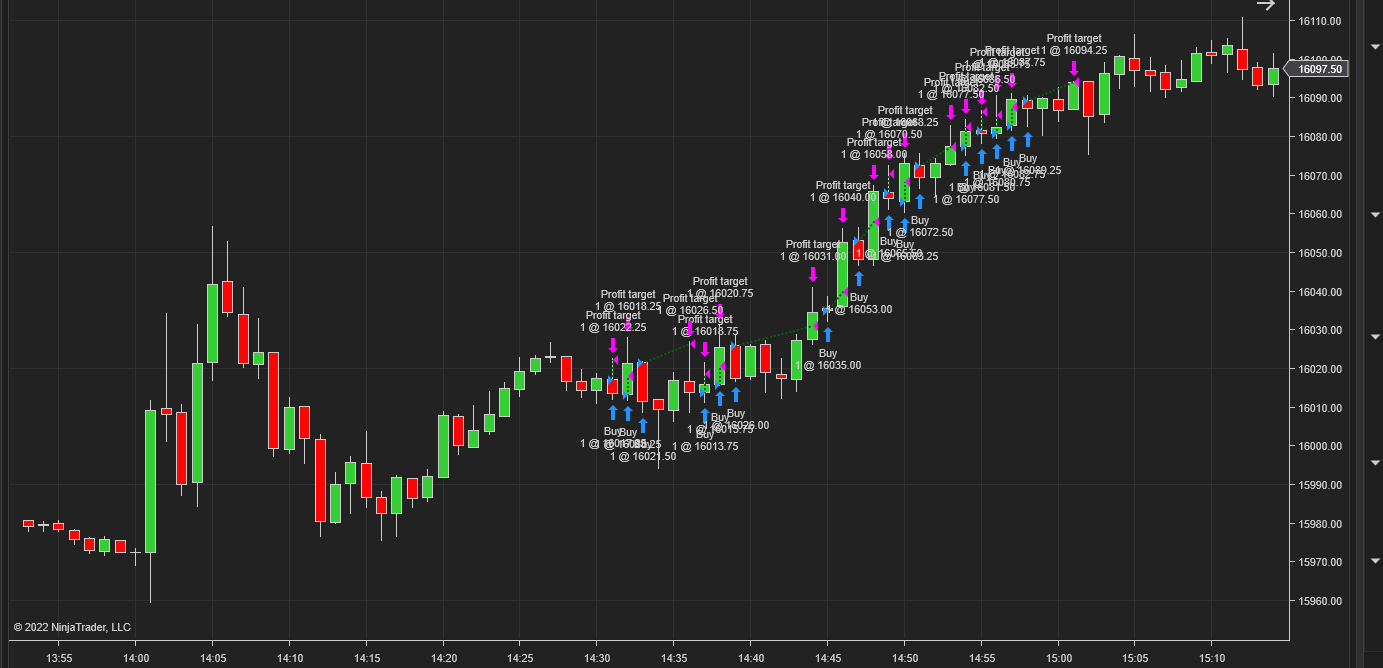
This is what Strategy 44b looks like in chart form. It makes on average 5.02 trades per day, and has an average net profit of $216 per day or $43 per trade on one NQ contract.
This is the cumulative profit of Strategy 44 over a 1 year period (01/01/2021 - 01/01/2022). It never falls lower than $6,365, but this is due to timing (when you start the strategy) more than anything else.
This is the cumulative profit of Strategy 44b over a 1 year period (01/01/2021 - 01/01/2022). It never falls lower than -$2,125.
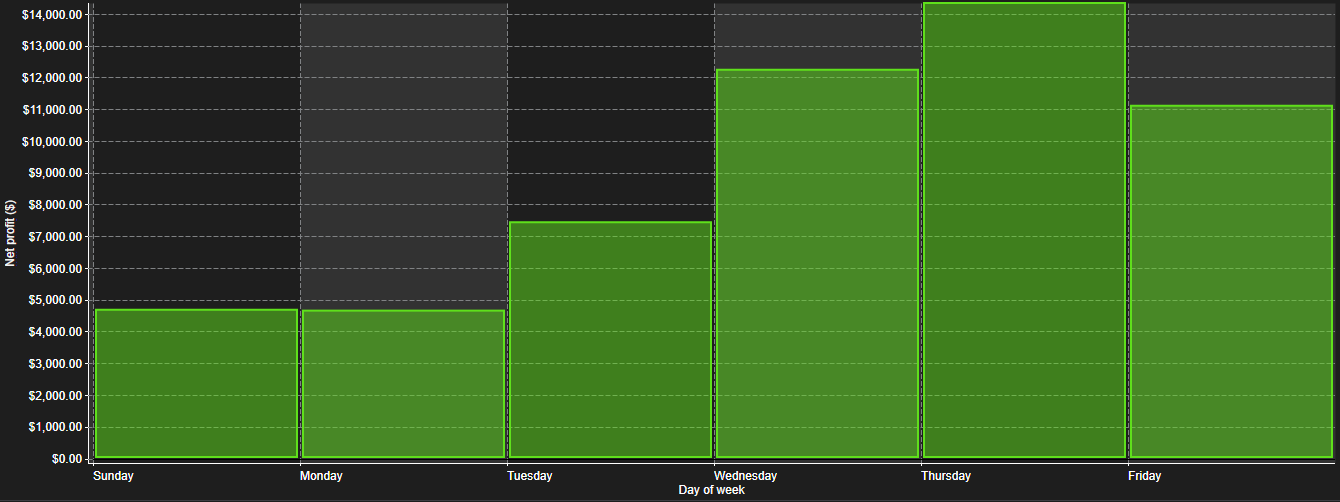
This is how the strategy breaks down on a day-of-week basis. Based on this chart, the strategy is profitable every day of the week.
This is how Strategy 44b breaks down on a day of week basis:
Strategy 44b is also profitable every day of the week, but instead of Monday, the best day to start trading the strategy appears to be Thursday (or at least it was in 2021).
This is a chart of the strategy by hour of day. The goal of the strategy is to catch slow moving trends up or down. As a result, an end-of-day exit bonanza is common and makes sense given the nature of the strategy.
This is the chart of strategy 44b by hour of day:
The take profit order has the effect of reversing the “end of session” bonanza. Instead of taking profit on slow moving trends up, Strategy 44b is taking a loss on a slow moving trend that went against the trade. These orders account for roughly $13K of the strategy’s losses. If there are any data analysts out there, the real information we need to know is the hour of day that most of the ‘end of session’ orders originate from.
Due to insights found in the Mudder Report (documentation of weekly strategy performance) we’ve decided to pay closer attention to weekly trends by adding a weekly chart to all strategy descriptions. We’re doing this for two reasons:
It might help with our weekly strategy selection process
It might help to determine the best time for entry, with the goal being a cumulative low greater than $0
In this case, the chart gives us an idea for what a normal high or low week looks like.
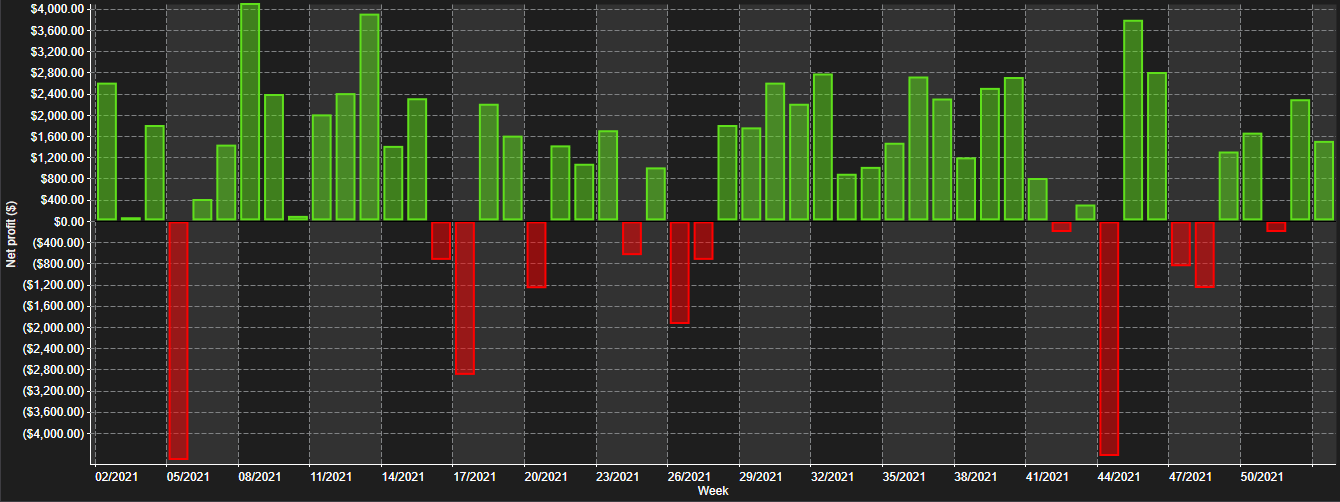
This is the weekly profile of Strategy 44.
There are no discernible trends in the weekly chart, but there are only 13 unprofitable weeks throughout the year compared to 39 profitable weeks.
This is in comparison to strategy 44b, which has the following weekly profile:
For strategy 44b there are only 12 unprofitable weeks, but you’ll notice, no weekly loss is ever more than $4,800. There are also never more than 2 negative weeks in a row.
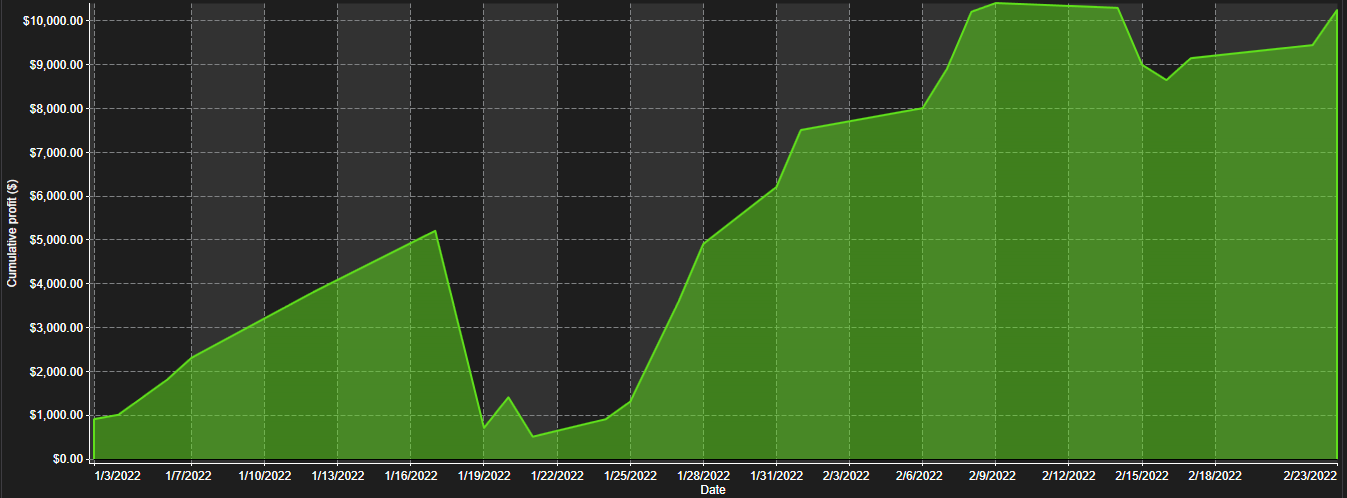
All performance charts so far have shown the performance of the strategy from January 1, 2021 to January 1, 2022. This is how Strategy 44b performed this year: from January 1, 2022 to February 23, 2022:
And this is the ‘daily trades’ table for the chart above.
The third column is cumulative net profit. You’ll notice that the strategy doesn’t trade every day — the longest flat period is 7 days since January of 2021 until now. You’ll also notice that the first trade was made on January 3 and that day made a total profit of $910. So, based on this backtest, if you started trading this strategy on January 1, 2022 you would be up $10,250 as of February 23, 2022.
Now, let’s talk about how to recreate these strategies for yourself.


