Which Equity Index Will Lead To The Holy Grail Of Automated Trade Strategy: NQ Vs. RTY
...or perhaps it's the ES

The hunt for the holy grail of automated trade strategy is an evolutionary process. We try to develop every clue. If it leads to something, we’ll share it with you. If it doesn’t, we’ll note it in the update, but we won’t publish anything that isn’t news.
The following research split the line. It came about after the discovery of Strategy 33. Strategy 33 is one of our most robust strategies to date. Click here to read more about what makes a strategy robust.
Strategy 33 performed well across multiple data series (range, minute, tick) so we decided to see how well it performed across multiple contracts as well. As you can see from the chart below, it performed well across the board. All contracts backtested were profitable for the year, but some performed better than others. The following backtest is based on data from August 2020 to August 2021.
One surprise that came out of this research was the performance of the Russell 2000 Index Futures (RTY) contract. It posted a profit factor of 2.59, which is higher than anything we’ve seen from the NASDAQ 100 Index Futures (NQ) contract. The S&P 500 Index Futures Contract (ES) also performed well for Strategy 33, with a net profitability of $109K for the year and a profit factor of 2.20.
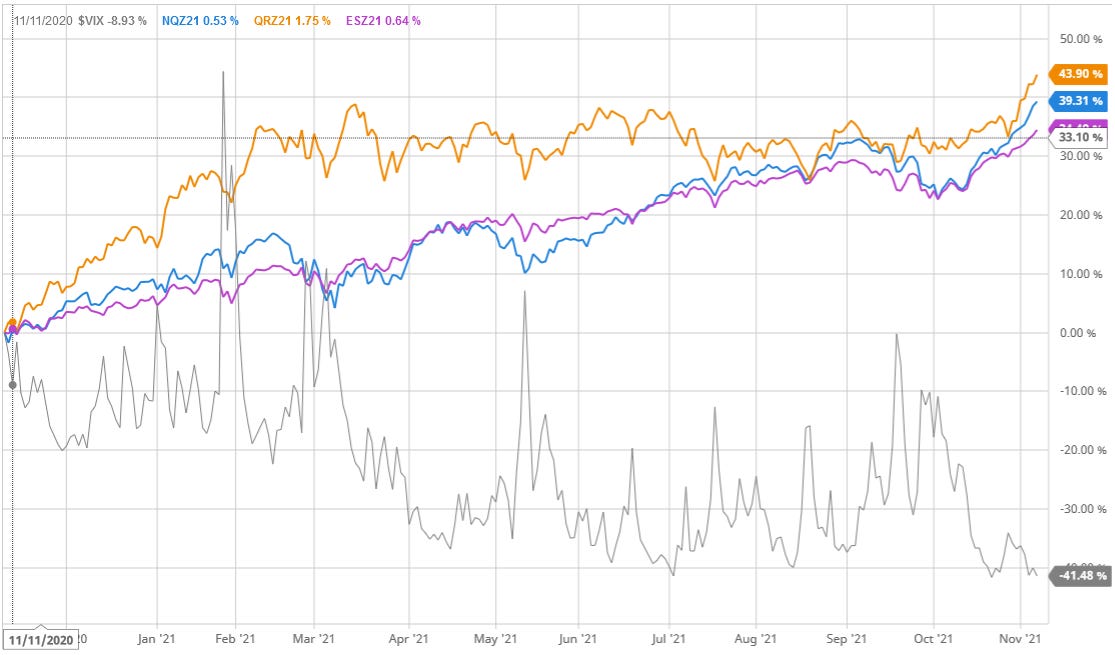
This isn’t especially surprising as RTY and ES tend to compete with NQ for the title of highest volatility among equity indices. Here’s a chart comparing their performance over the last year against the CBOE Volatility Index (VIX), a measure of the stock market's expectation of volatility based on S&P 500 index options.
NQ is blue, RTY is orange, ES is purple and the VIX is grey. One thing you will notice is that all three indices tend to decline with a spike in volatility. In other words, there appears to be a negative correlation between the VIX and equity indices. This is because the trend is up; it is also a spread we’re looking to exploit (more on this in a future post).
The question is, is Strategy 33 just an anomaly or is RTY (and possibly ES) a better market to hunt for the holy grail of trade strategy in? If so, why? Is it because RTY and ES have a similar market structure with NQ, or is it because these are the most volatile indices on the market?
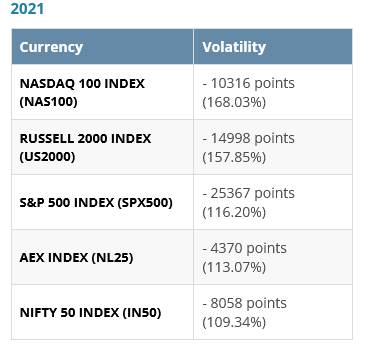
The chart below provides an overview of the most volatile equity indices.
As a quick review, the definition of volatility is as follows:
“A measure of dispersion around the mean of a security.”
The chart above measures volatility in terms of point spread. The further the price of an asset is away from its mean, the more volatile it is. From a trading perspective, the higher the deviation of price to the mean, the higher the potential investment. So when traders are looking at the market profile, we’re looking for markets with the highest deviation from the mean. This is why diversion strategies tend to be so successful. It’s also why we started our hunt with NQ, but it’s also why we’ve expanded our hunt to include other volatile assets like crypto. Ultimately, we would like to determine if our strategies are skewed toward high volatility markets or markets with a similar market structure to NQ because we have reason to believe that 2022 is going to be a highly volatile year and knowing this could help with strategy selection/creation — we’ll be talking a bit about why we think that is in our next post. So far our research is inconclusive, but we’re making progress.
RTY Backtest: The Results
The next step is to conduct a backtest on RTY to see if the performance for all Strategies is comparable to Strategy 33 or if Strategy 33 is simply an anomaly.
The chart below is the backtest from November of 2020 to November of 2021. It is based on trading 1 RTY contract.


