

Important: There is no guarantee that ATS strategies will have the same performance in the future. I use backtests and forward tests to compare historical strategy performance. Backtests are based on historical data, not real-time data so the results shared are hypothetical, not real. Forward tests are based on live data, however, they use a simulated account. Any success I have with live trading is untypical. Trading futures is extremely risky. You should only use risk capital to fund live futures accounts and if you do trade live, be prepared to lose your entire account. There are no guarantees that any performance you see here will continue in the future. I recommend using ATS strategies in simulated trading until you/we find the holy grail of trade strategy. This is strictly for learning purposes.
I’m on a quest for the holy grail of automated trading. Questions? Check the FAQs or feel free to reach out directly: AutomatedTradingStrategies@protonmail.com.
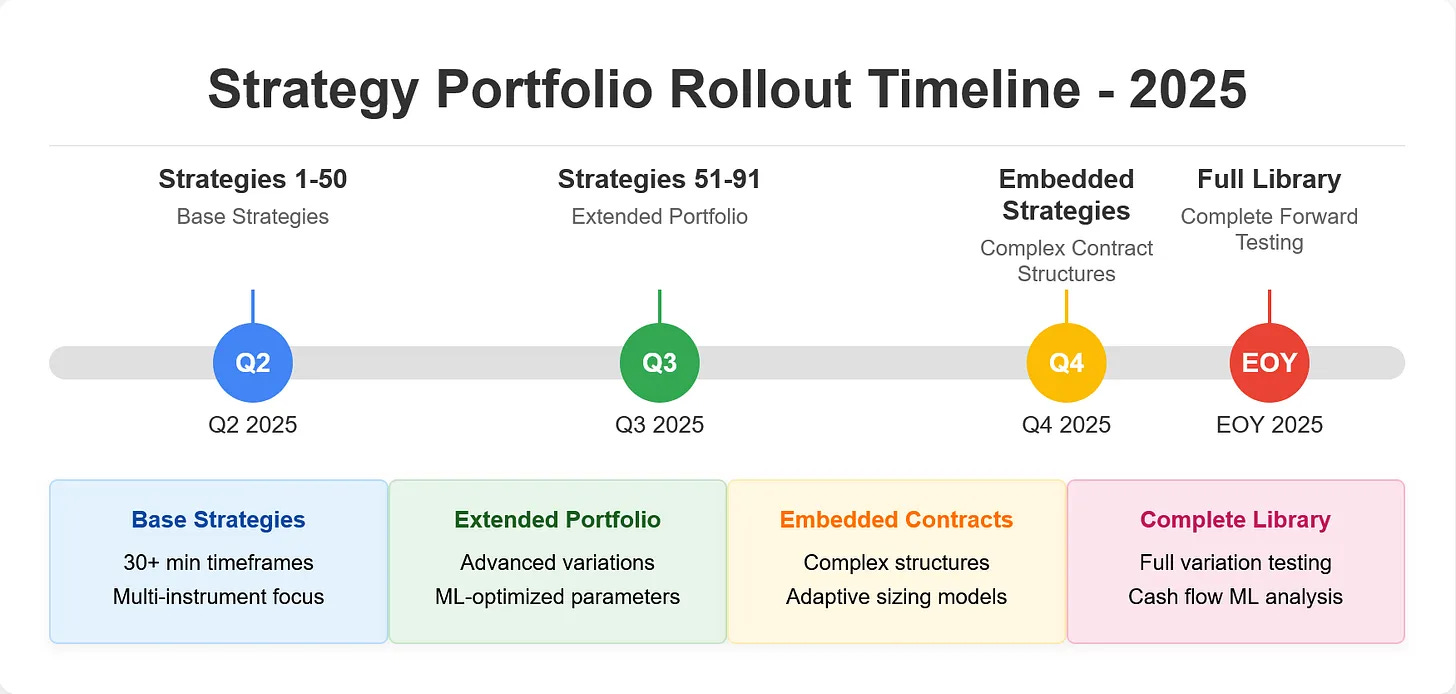
The Q3 2025 Forward Test
As a quick reminder, the Q3 Forward Test contains ~20 ATS trading strategies across 16 unique strategy types deployed on various instruments and timeframes.
Instruments Traded
NQ (Nasdaq futures)
MNQ (Micro Nasdaq)
GC (Gold futures)
ES (E-mini S&P 500)
ZN (10-Year Treasury Note)
ZB (30-Year Treasury Bond)
Data Series / Bar Frequency
Minute-based: 22 strategies (ranging from 5-minute to 90-minute)
Tick-based: 2 strategies (1,400 tick)
Account Structure
All strategies run on simulated accounts
Account naming convention: SimAccountStrategyNumberStrategyNumberStrategyNumberInstrumentInstrumentInstrumentTimeframeTimeframeTimeframe
Some accounts run multiple instruments or timeframes
At the end of each quarter, I will remove poor performers and replace with standouts from the Incubator.
The Incubator is running variations of the first 100 strategies. In Q4, I’ll add embedded strategies.
The hope is to obtain as much actual data as possible for ML pattern recognition analysis by year’s end.
More Data
It’s all about the data this year. More data and higher-quality data improve performance. I’m also using the data to make revelations about trading a portfolio of strategies—from the selection process to capital allocation, every decision has an expectation that is constantly challenged with reality. Better data not only informs a clearer version of that reality, but helps to focus the lens where needed.
For example, we are not hunting volatility—we are hunting one-directional volatility. Most automated strategies struggle with change-point detection. Mean reversion is often used as a proxy, but it can be like threading a needle in trending markets. I’ve also learned that the best-performing days fall on days when nothing happens, which means the best pattern for automated trading strategies is a one-directional trend that occurs on days with no big announcements or events. While FOMC/CPI days have great potential, they are not as consistent.
Now let’s get into Q3 Forward Test performance and what the data tells us about taking Q4 to the next level. At the end, I’ll share the tentative Q4 Forward Test strategies and instruments with you.
Q3 Forward Test Performance
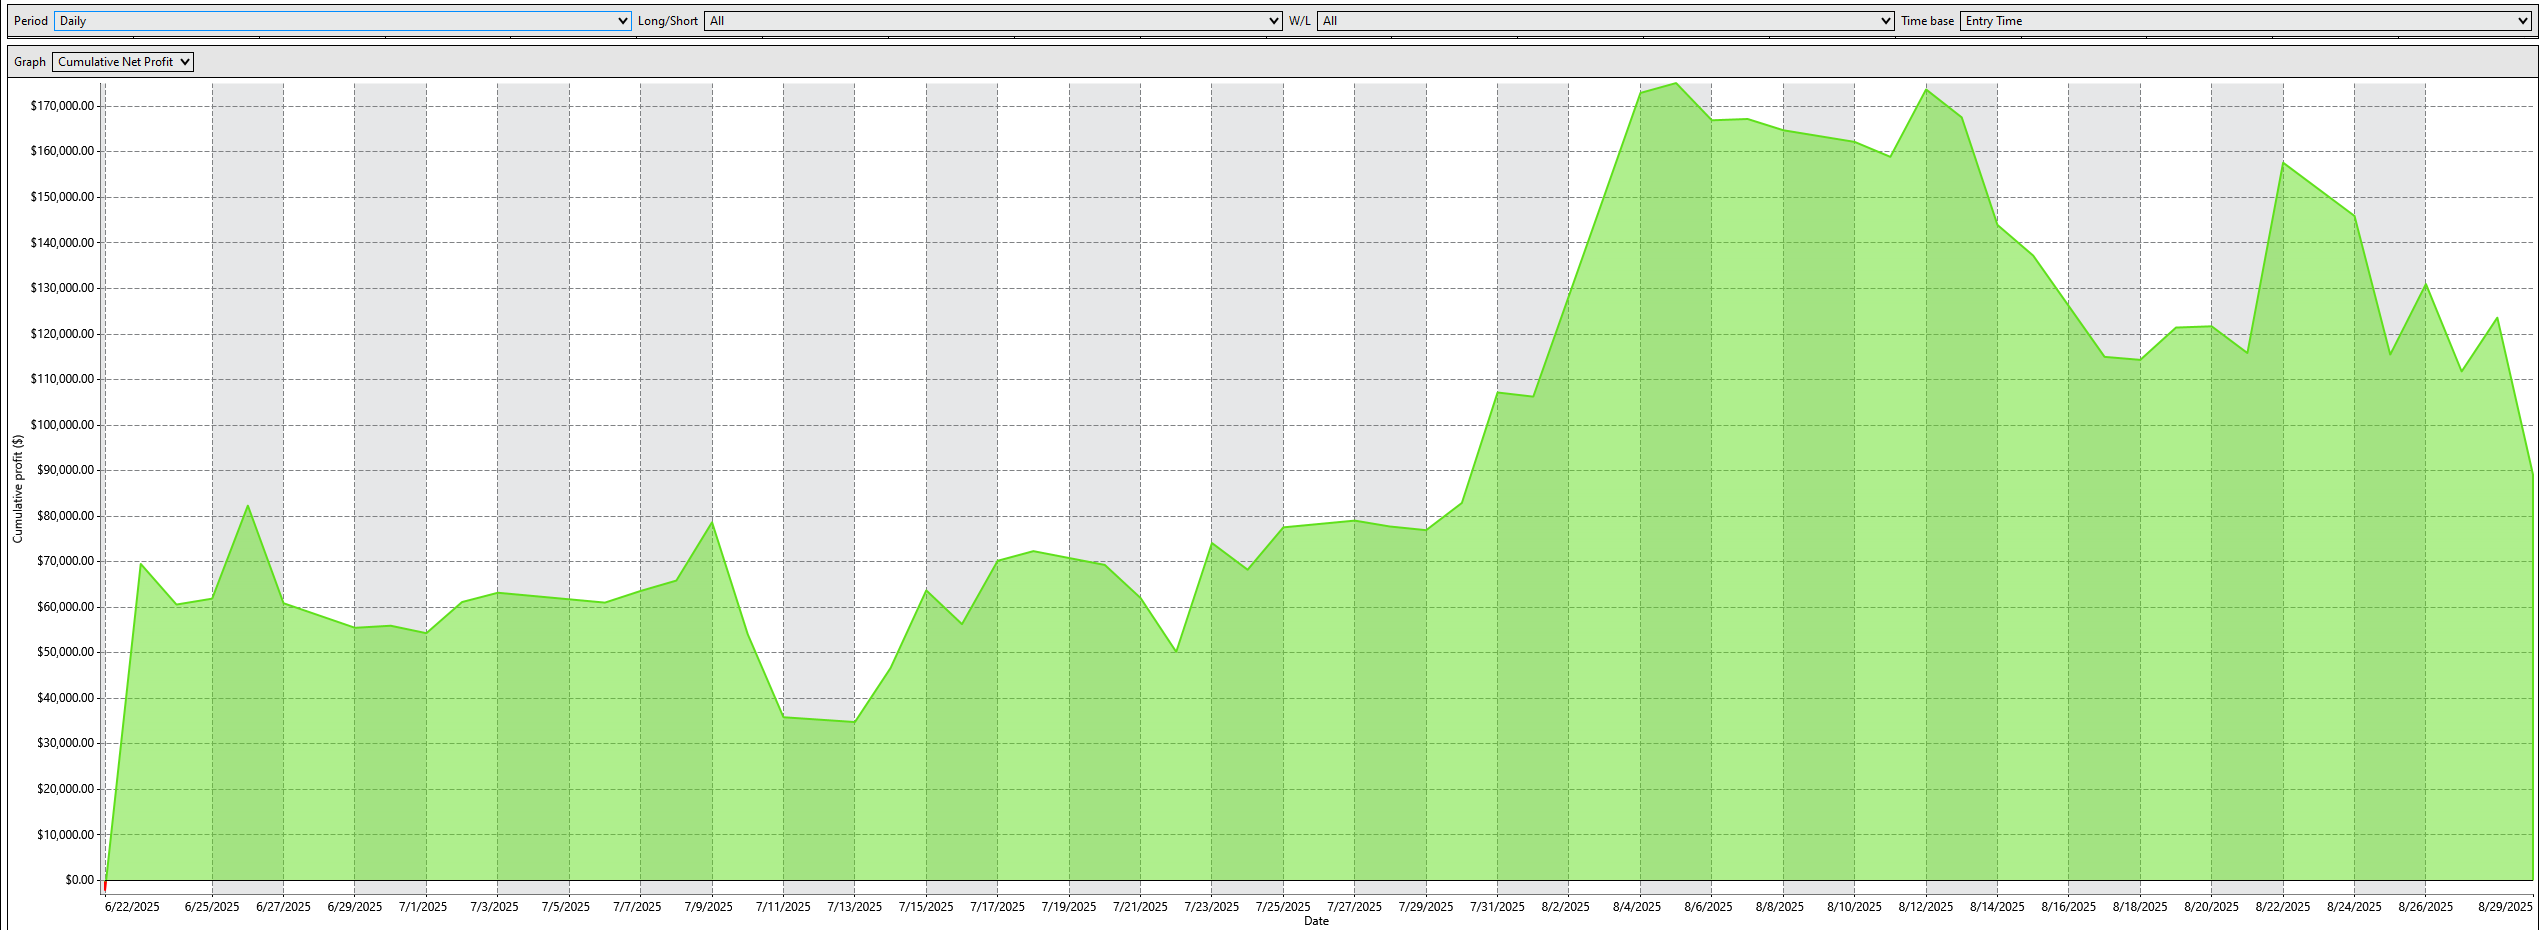
A few weeks ago I shared the Q3 Forward Test results with you.
At that time, the portfolio was up $70,165, but we were in a pretty severe drawdown. Here’s an overview of daily performance:
Here’s where we stand after September 17th:
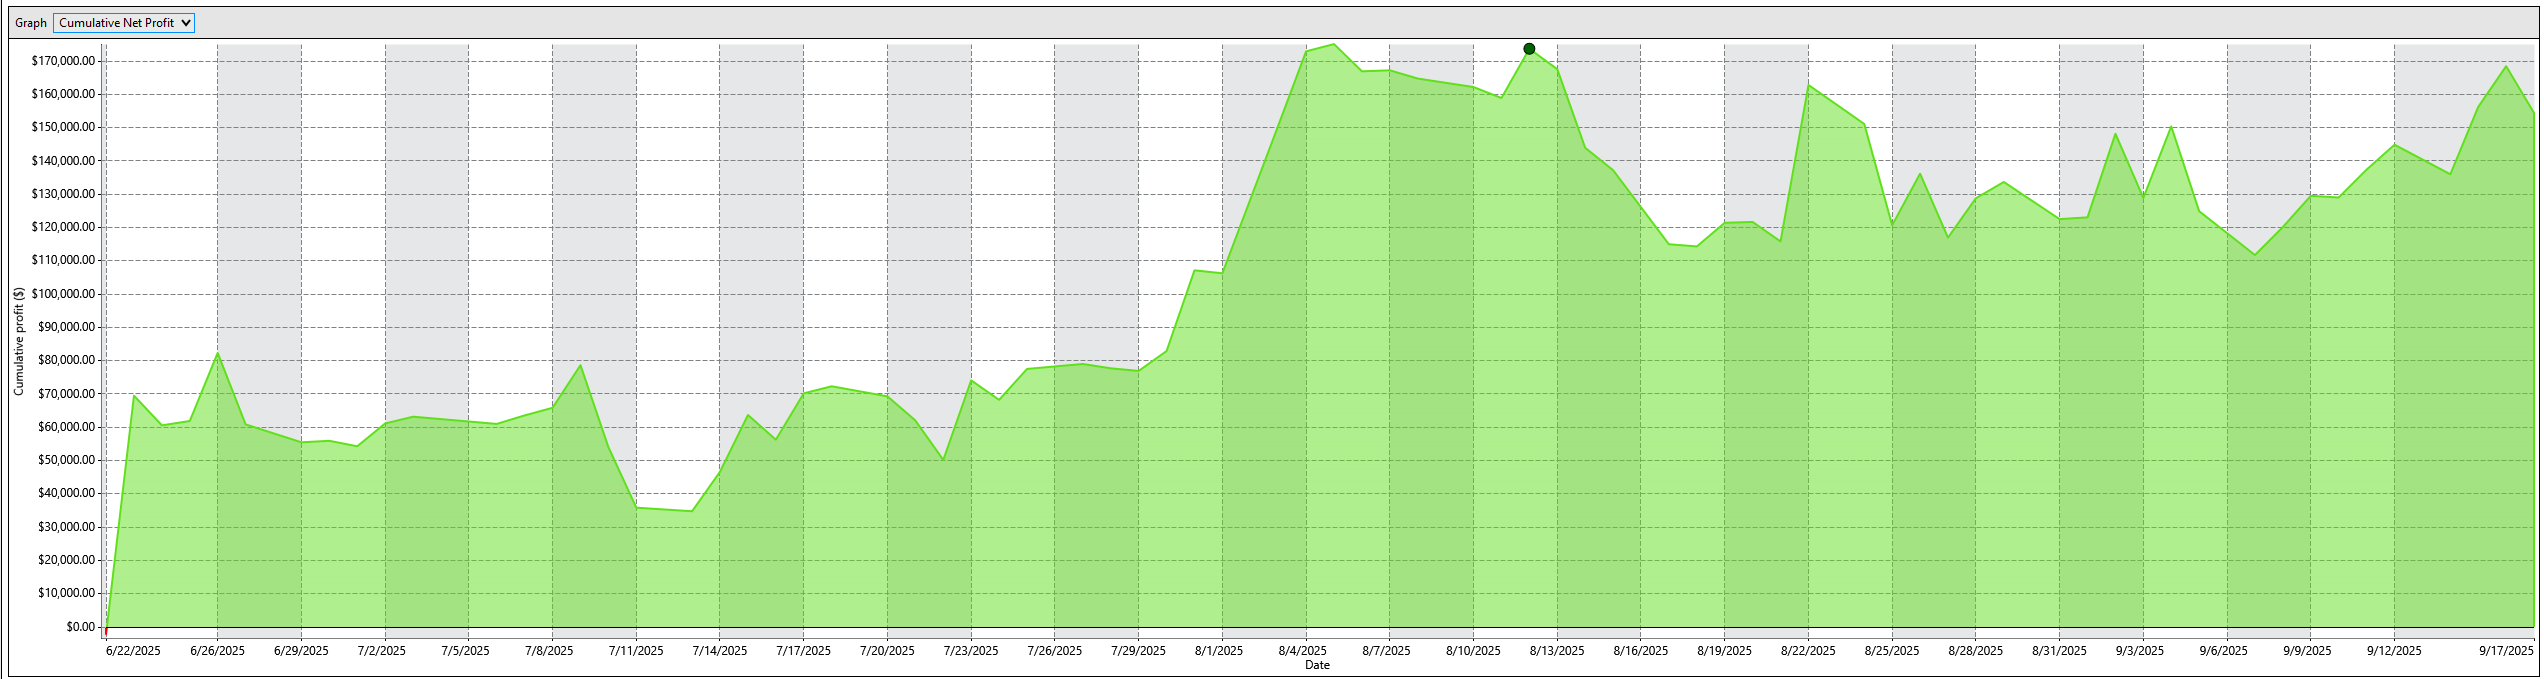
While the 17th failed to impress, the portfolio still made a nice rebound from its drawdown low, going from $70,165 to $154,427. The largest drawdown was $90K, but the account never went lower than -$2,615.
Q3 End of Quarter Stats
Final Portfolio Value: $154,427
Lowest Equity Point: –$2,615 (portfolio was never lower than this)
Maximum Drawdown: $89,606; 50% from a peak of $177,091 down to $87,485
MAR (Return ÷ MaxDD): 1.72; 1.72 means it made $1.72 in net profit for every $1.00 of drawdown endured.
Aggressive MAR (Return ÷ Lowest Equity Point): 59x. So the portfolio earned 59 dollars for every 1 dollar it dipped below breakeven at its lowest point.
Sharpe (normalized to $100k): 1.21
Sortino (normalized to $100k): 1.63
Annualized return (on $100k proxy): 182%
The best hours to enable trades were:
4:00 AM ET: +$69,472 ($542.75 avg per trade)
10:00 AM ET: +$46,706 ($491.64 avg)
12:00 PM ET: +$34,673 ($412.78 avg)
Day-of-week performance:
Monday/Tuesday dominance: +$177,553 combined profit
Sunday/Wednesday weakness: –$61,352 combined loss
Other observations:
FOMC whipsaw pattern: Poor day-of performance, explosive next-day recovery (a new pattern).
High-volume days (>50 trades): Only 33% win rate, but positive expectancy.
Gold futures (GC): Massive volatility (–$109K in GC 12-25) requires position sizing adjustment.