Analyzing Trade Level Statistics To Identify The Best Entry & Exit Signals in the ATS Portfolio: Part II
ATS Research
Important: There is no guarantee that these strategies will have the same performance in the future. I use backtests to compare historical strategy performance. Backtests are based on historical data, not real-time data so the results shared are hypothetical, not real. Even with forward tests, there is no guarantee that performance will continue in the future. Trading futures is extremely risky. If you trade futures live, be prepared to lose your entire account. I recommend using these strategies in simulated trading until you/we find the holy grail of trade strategy.
As a quick reminder, the goal of ATS Research is to add value to strategies in ATS and the goal of ATS is to find the holy grail of automated trade strategy.

This post is a continuation of Part I.
The goal is to ‘re-engineer’ a better strategy by identifying the best components of each. The first area for improvement is trade efficiency, which can be measured based on entry and exit commands using the metrics MAE, MFE and ETD:
MAE = Maximum Adverse Excursion: peak potential profitability during a trade.
MFE = Maximum Favorable Excursion: peak potential loss during the trade.
ETD = End Trade Drawdown: final loss from the peak value of the trade.
You can think of MFE as a whole pizza pie. MAE takes a few pieces from one half of the pie, and ETD takes a few pieces from the other. So, the more pizza you’re left with, as a percentage of the whole, the more efficient the strategy.
We are trying to use this logic to re-engineer a more efficient strategy by not only looking for strategies with more pizza, but smaller slices. Looking at the ratio of MFE to MAE and MFE to ETD, we get a relative measure for not only the profit potential, but the risk involved with each trade. In general, the larger the slices, the greater the risk.
Backtest Vs The Forward Test
In Part I we identified several strategies with the highest MFE/MAE ratio and the highest MFE/ETD ratio based on the Q2 2024 Backtest. In other words, we found those strategies with the best entry and exit signals so we could match the best entries with the best exits. Those strategies were:
Strategies 4, 32, and 80Long for entry (the highest MFE/MAE ratio)
Strategies 80long, 76, 15, and 58 for exit (the highest MFE/ETD ratio)
Strategy 4 is performing well this year, as is 15, 32, 58, and 76, but 80Long hasn’t been trading long enough to tell.
Still, one thing we’ve learned by now is that relying on a backtest to provide correct information is preparing to fail. I’d say the information provided by a backtest is correct ~60% of the time. It’s just a map, and is not to be confused with the real thing.
So what is the real thing?
The real thing in trading is always trading live, but testing strategies live requires the loss of a great deal of risk capital. There is a hybrid form of testing—one that’s safer than a live test, but more reliable than a backtest: a simulated live test. This is a test that uses a simulated account, but that account is driven by live data. That’s what the ATS Forward Test is. Click here to learn how to create a forward test of your own.
The ATS Forward Test is currently running over 150 strategies to see if any of the strategies in the ATS Backtest are worth trading live. So, I’m going to use forward test data from January 1, 2024 through May 14, 2024 to see which strategies have the best entry and exit stats.
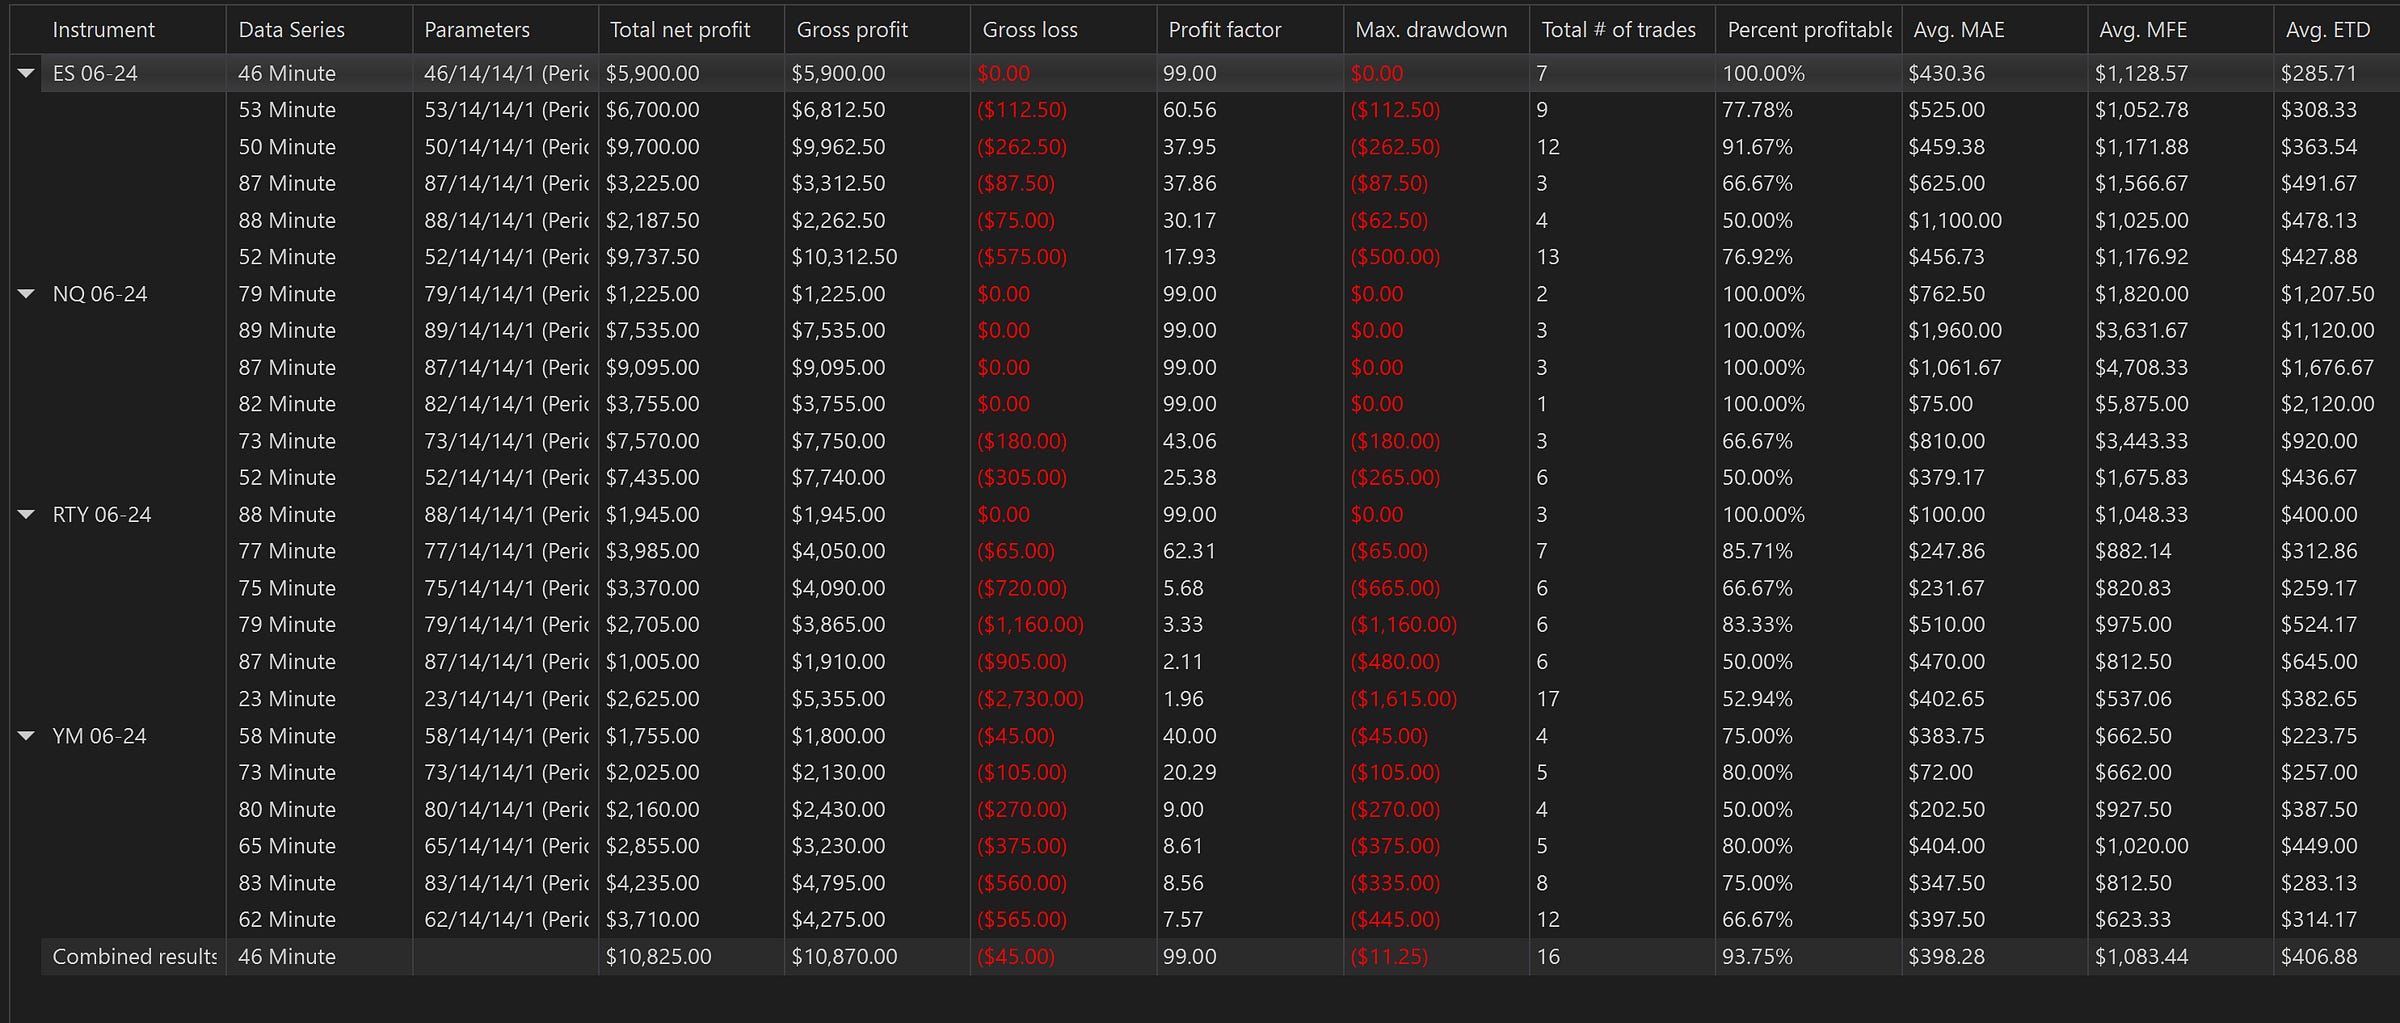
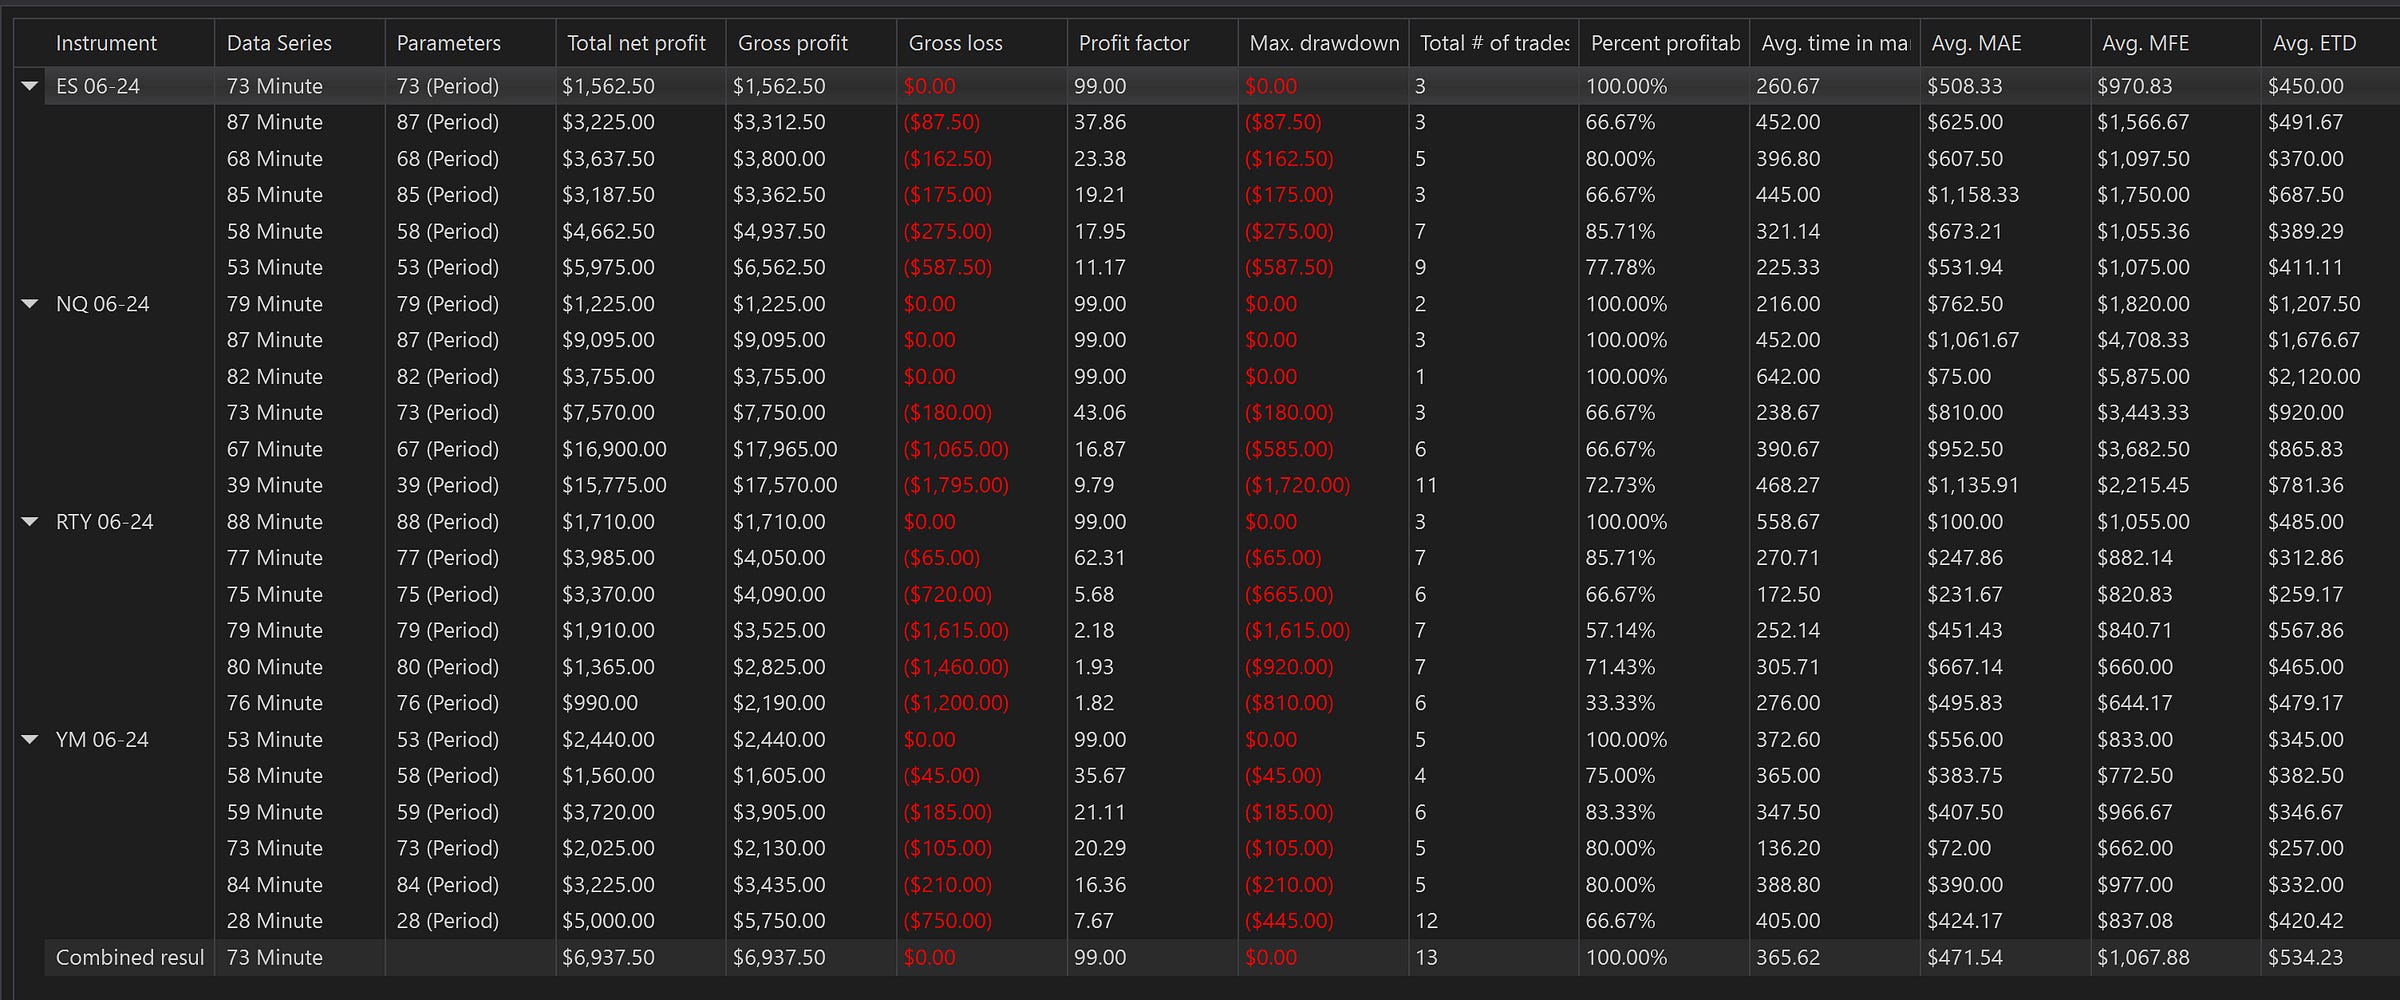
As an example, I “re-engineered” the following strategies and ran them through a data series optimization from January 1, 2024 through May 14, 2024. These are the top 6 results from equity futures contracts ES, NQ, RTY, YM. I’ll be running the top three from each in the forward test.
Strategy 83a
Strategy 83b
Strategy 83c
There are many options: these are only three possible combinations.
Subscribers of ATS can download Strategy 83a in the Download section of the Strategy 16.
Subscribers of ATS can can also download Strategy 83b in the Download section of the Strategy 7 or Strategy 16 strategy description on ATS.
Trading Efficiency Chart
The following chart shows the entry and exit values associated with each strategy in the 2024 Forward Test. You can also download this as a spreadsheet at the bottom of this post.
There are two colors noted on this chart: green is favorable and yellow is unfavorable. In other words, strategies with green are highly efficient and/or have highly efficient entry and exit commands, whereas strategies with yellow are highly inefficient. You can use both to help “construct” a better strategy. For example, in addition to matching highly efficient entries with highly efficient exits, you can also create strategies with high MFE’s and low ETDs or swap out those strategies with high MAEs for low MAEs. And remember, these stats are based on forward test results, which means they are based on live, not historical data:


