

How To Determine Starting Account Value
Plus A Preview From The Q4 2024 Performance Report
Important: There is no guarantee that ATS strategies will have the same performance in the future. I use backtests and forward tests to compare historical strategy performance. Backtests are based on historical data, not real-time data so the results shared are hypothetical, not real. Forward tests are based on live data, however, they use a simulated account. Any success I have with live trading is untypical. Trading futures is extremely risky. You should only use risk capital to fund live futures accounts and if you do trade live, be prepared to lose your entire account. There are no guarantees that any performance you see here will continue in the future. This is for educational purposes only. I recommend using ATS strategies in simulated trading until you/we find the holy grail of trade strategy.
"The first principle of investment returns is understanding your cost basis. Without it, you're navigating without coordinates."
- Peter Lynch
One of the most common questions I receive from new subscribers goes something like this: "When you say a strategy made $40,000, I can't tell if that's a good return or not without knowing the starting account size. Why don't you just set a standard account value like with stocks?"
It's a great question and I suspect there are many ‘not-so-new’ subscribers that might be able to benefit from the answer to this question as well, so today I want to explain:
why futures trading is different from stocks,
how to think about account risk and return; and most importantly,
how to calculate the best starting account size for the strategy you want to trade.
I’ll also give you my recommendations for starting account value on the strategies in the Q1 2025 Forward Test.
Futures vs. Stocks
All strategies in the Q4 portfolio trade on futures contracts. Futures also receive preferential tax treatment, can trade nearly 24 hours a day, five days a week; they offer exceptional liquidity (reduced slippage), and have no pattern day trading rules. Perhaps the biggest disadvantage with trading futures over stocks, however, is the leverage risk, which requires strict risk management, and substantial risk capital buffers. This leverage is the reason why returns on futures are generally so much higher than the stock market.
What kind of returns are we talking about?
Here’s a summary of the returns for the top 10 performing strategies in the ATS Q4 2024 Forward Test. Subscribers, scroll to the bottom to view strategy account name.
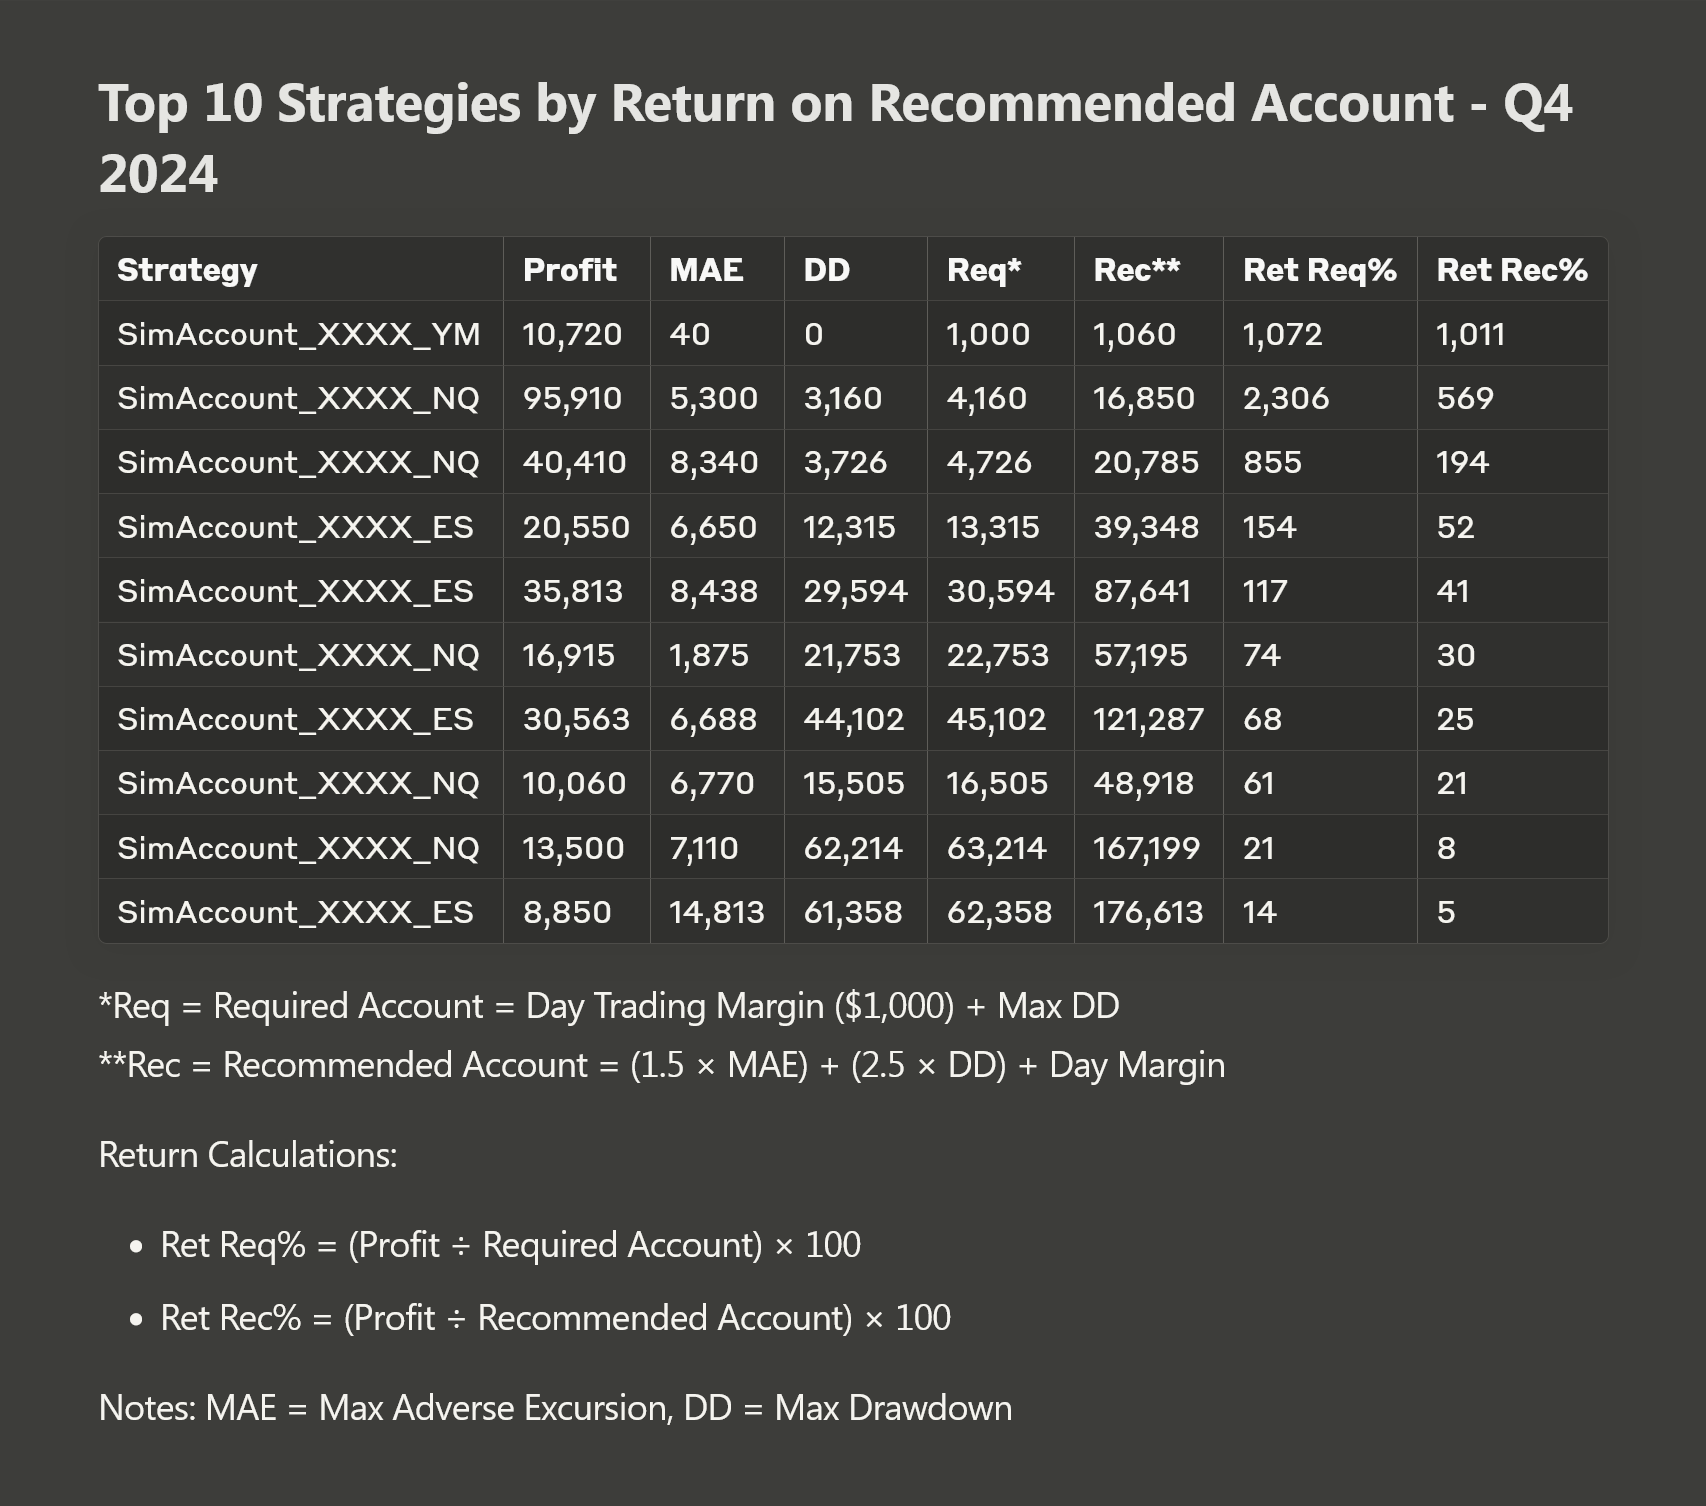
At a high level, this chart is showing you the highest performing strategies in the Q4 2024 Forward Portfolio based on return. It is also showing you the calculation I use for both the Required Minimum Account Value and the Recommended Minimum Account Value for each strategy.
As you can see, even the most conservative return metric produced amplified returns with one strategy making over 1,000% return and another making 569% return. But return on what?
How Do I Determine Starting Account Value For Each Strategy
When you trade stocks, the math is straightforward. If you invest $10,000 and make $1,000, you've earned a 10% return. Simple. Futures trading is different.
What makes it different?
Futures contracts use margin, which means you only put up a fraction of the contract's full value. Click here to see the margin requirements for Ninjatrader Brokerage.
The good news is that we can use the Q4 forward test results to determine the starting account value for each strategy.
To do this, we are going to use two risk metrics:
Maximum Adverse Excursion (Max MAE) measures the worst intra-trade loss—how far a single trade goes against you before either recovering or being closed. Think of it as the deepest underwater point during any single trade.
Maximum Drawdown (Max DD) measures the largest peak-to-trough decline in your total account equity across multiple trades. It's like looking at your account balance over time and measuring the biggest drop from any high point to the subsequent low point.
The key distinction is that Max MAE is the largest single trade while Max DD measures the biggest drop in your account value over the the entire trade period.
Required Starting Account Value: The Absolute Minimum
The required account value represents the bare minimum capital needed to trade that strategy. I calculate this by adding:
Margin requirement ($1,000 for NQ)
The largest historical drawdown (Max DD)
Let's use a real example. One of our highest performing strategies from above trades NQ futures and has a Max DD of $3,160, so the required account value is:
Required Account = Day Trading Margin + Max DD
Required Account = $1,000 + $3,160 = $4,160
This required value ensures you can:
Meet the broker's day trading margin requirements
Survive the worst historical drawdown the strategy has experienced
However, trading with only the required account value is like driving across the desert with just enough gas to reach the next station—it might work, but it leaves no room for error. This is especially problematic when first starting out.
Recommended Starting Account Value: Increase Your Cushion
The following approach provides a more comfortable cushion while remaining achievable for most traders. Here's the formula:
Recommended Account = (1.5 × Max MAE) + (2.5 × Max DD) + Day Trading Margin
Let's understand why each component matters and how they work together:
Maximum Adverse Excursion (MAE) × 1.5
MAE shows how far a single trade might move against you before turning profitable
The 1.5 multiplier gives you breathing room during these temporary swings
Example: If Max MAE is $5,300, this component would be $7,950
Maximum Drawdown (Max DD) × 2.5
Max DD shows the largest peak-to-trough decline in your account
The 2.5 multiplier helps you weather extended rough patches
Example: If Max DD is $3,160, this component would be $7,900
Day Trading Margin
The broker's requirement for day trading
For NQ futures, currently $1,000
Using these example numbers:
Recommended Starting Account Value = (1.5 × $5,300) + (2.5 × $3,160) + $1,000
= $7,950 + $7,900 + $1,000
= $16,850
Why This Approach Makes Sense
Traditional futures trading guides often suggest much larger multiples (like 50× MAE or 5× Max DD), which can make futures trading seem out of reach. This more moderate approach:
Recognizes that modern futures trading platforms offer reasonable day trading margins
Provides meaningful, strategy-specific risk protection—there is no one-size fits all account size for every strategy
Makes futures trading accessible to more traders
Balances safety with practicality
Real-World Application
When starting with a new strategy:
Calculate the Required Account Value and the Recommended Account Value, but use the Recommended Account Value as your target starting point.
Consider keeping additional funds accessible, but not in your trading account for that strategy.
Scale position size based on your actual account size relative to these numbers.
For example, a trader starting with $20,000 would be comfortably above my example of a recommended account value, while someone starting with $10,000 would still be well above the required minimum, but might want to be more conservative with position sizing.
Understanding Returns in Futures Trading
Now that we understand how to determine appropriate account sizes, let's explore how to apply this to returns. This is particularly important because futures trading returns can look wildly different depending on how you measure the starting account value.
Two Ways to Calculate Strategy-Based Returns
Return on Required Account Value
This measures your return against the minimum capital needed to trade that strategy:
Return on Required Capital = Net Profit / Required Account Value
Using our example strategy (SimAccount15):
Return = ($95,910 / $4,160) * 100 = 2,306%
While this number looks impressive, it's somewhat misleading because trading with only the required capital would be extremely risky.
Return on Recommended Account Value
This provides a more realistic view of your returns based on a properly sized account:
Return on Recommended Capital = Net Profit / Recommended Account Value
Using our example:
Return = ($95,910 / $16,850) * 100 = 569%
This gives us a more balanced perspective, though it's still quite impressive due to the leverage available in futures trading.
So to bring this full circle, you want to use the same approach to calculate account start value as you do for measuring return. Remember that in futures trading, massive percentage returns are possible due to leverage, but this also means significant risks. The good news is that those risks can be both measured and managed.
What’s Next
In a few days I’m going to share the Q4 2024 Forward Test Analysis (paid subscribers only) as well as the results of the first two weeks of the Q1 2025 Forward Test, which have been quite impressive. I also provide an analysis of:
the top performing strategies by instrument
the top performing strategies by net profit
the top performing strategies by strategy family
the top performing strategies by efficiency
I also share some insights that will likely prove helpful for future strategy development. For example, based on the data, there appears to be a counterintuitive relationship between MAE and profitability. You might expect higher MAE to correlate with higher profits, but the data shows something more nuanced and I’ll share that with you on Sunday.
I hope this overview helped. Please let me know if you have any questions.